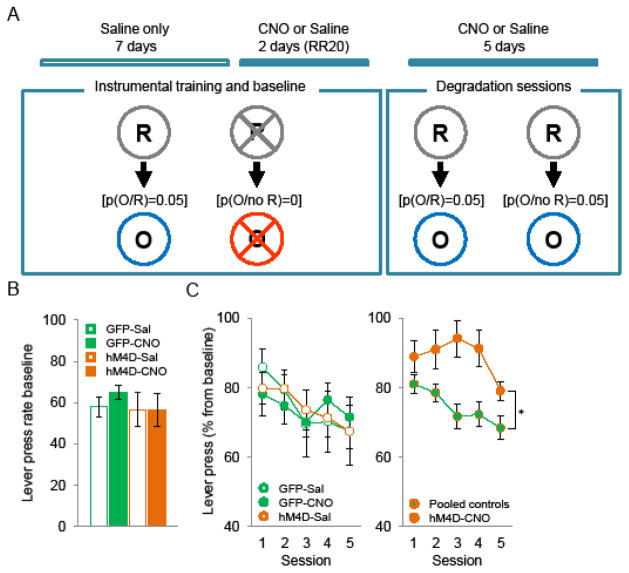
Figure 3.
Effect of decreased MD activity on instrumental contingency degradation. A, Schematic drawing of the experiment design. Abbreviations: Lever-press response (R), outcome (milk) (O). [p(O/R)=0.05]: probability of obtaining outcome after lever press is 5%. [p(O/no R)=0]: probability of obtaining outcome meanwhile no pressing is 0% B, Mean lever press performed per minute (±SEM) during 20 minutes instrumental training session. C, Mean lever presses (in percentage from baseline) (±SEM) across the contingency degradation sessions. Left panel: control groups. Right panel: pooled controls vs CNO-treated MDhM4D mice (GFP-Sal n=8, GFP-CNO n=7, hM4D-Sal n=15, hM4D-CNO n=14).

