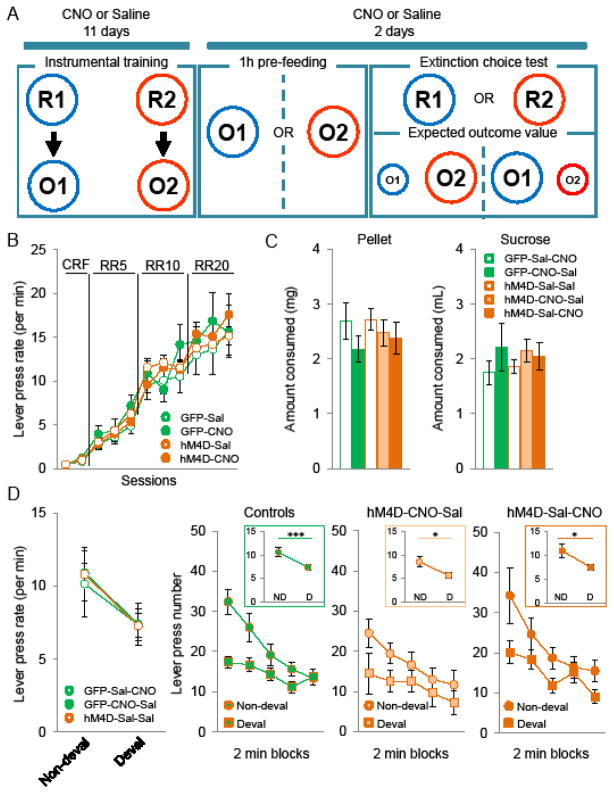
Figure 4.
Effect of decreased MD activity on instrumental outcome devaluation task. A, Schematic drawing of the experiment design. Abbreviations: Response 1 (left lever press) (R1), response 2 (right lever) (R2), outcome 1 (pellet) (O1), outcome 2 (sucrose) (O2). B, Mean lever press performed per minute (±SEM) during instrumental training (GFP-Sal n=6, GFP-CNO n=5, hM4D-Sal n=23, hM4D-CNO n=12). C, Mean of consumed food (±SEM) (pellet on left panel, sucrose on right panel) during the pre-feeding phase. D, Mean lever press performed per minute (±SEM) on the non-devalued and devalued lever in the three control groups. E, Mean number of lever press on the non-devalued and devalued lever (±SEM) across successive two-minutes blocks of extinction choice test in controls (left panel) and CNO-treated MDhM4D mice. Insets: mean lever press performed per minute (±SEM) on the non-devalued and devalued lever (GFP-Sal-CNO n=6, GFP-CNO-Sal n=5, hM4D-Sal-Sal n=10, hM4D-CNO-Sal n=12, hM4D-Sal-CNO n=13).

