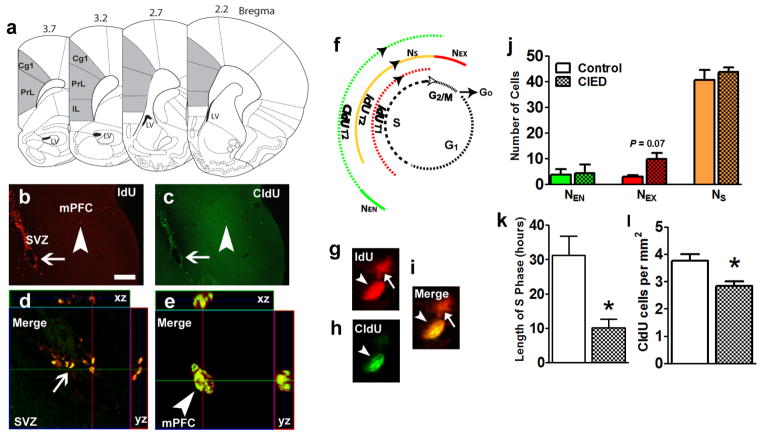
Figure 5.
CIE reduces the length of the S-phase of the cell cycle of mPFC progenitors. (a) Schematic of bregma regions and the area of prefrontal cortex included for quantification. Area shaded in gray included the cingulate cortex (Cg), prelimbic cortex (PrL), and infralimbic cortex (IL). (b–c) Representative epifluorescent images of IdU (b) and CldU (c) labeling in the subventricular zone (SVZ) and mPFC from one control animal. Thin arrow in (b, c) points to cells in the SVZ and arrowhead in (b, c) points to a IdU/CldU double labeled cell in the mPFC. (d–e) Orthogonal view of IdU/CldU labeled cells in the SVZ (d) and mPFC (e) showing equal penetration of antibodies in the xz and yz planes. (f) Schematic representation of the cell cycle of proliferating progenitors in the mPFC. S, synthesis phase; G1, gap1 phase; G2, gap2 phase and M, mitosis. Ns is number of cells in S phase, NEX is number of cells exiting the S phase, NEN is number of cells entering the S phase of the cell cycle. Injections of IdU were given at T, time = 0h and Cldu were given at T = 2h. (g–i) Representative confocal images of IdU (red, g) and CldU (green, h) labeled cells in the mPFC from one control animal. (j) Quantitative analysis of number of IdU or CldU or IdU/CldU cells in the mPFC per animal from 4 pairs of bilateral mPFC sections. (k) Length of S phase of proliferating progenitors in the mPFC expressed in hours. (l) Total number of CldU only cells in the mPFC represented as number of cells per mm2 of the mPFC. n = 6 animals in each group. *p < 0.05 compared with controls.

