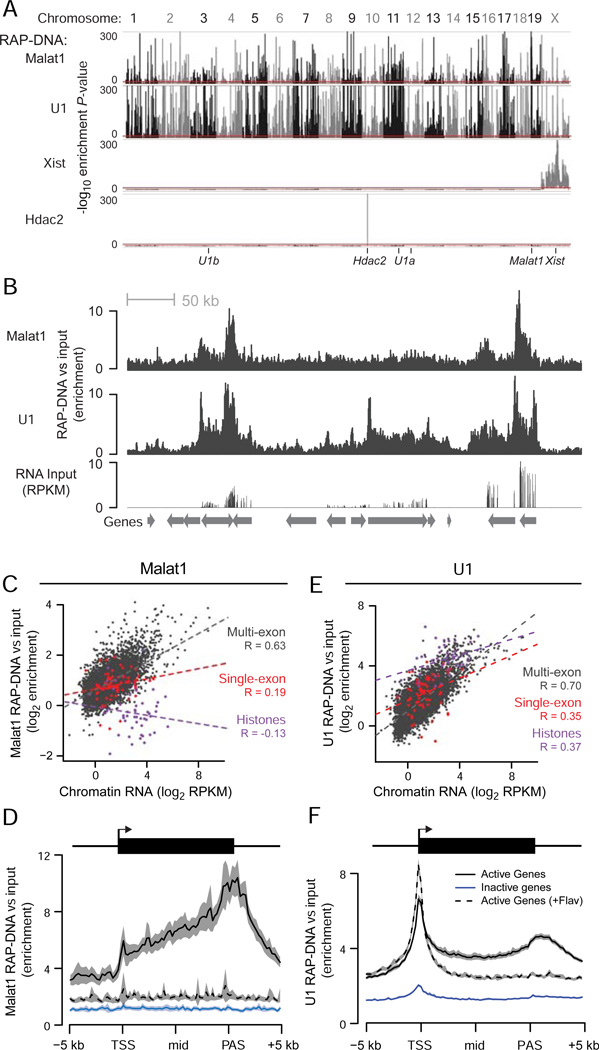
Figure 4. Chromatin Localization of U1 and Malat1.
(A) Significance of enrichment across the genome in 10-kb windows for Malat1, U1, Xist, and Hdac2 RAP-DNA. Y-axis represents uncorrected binomial P-values, and the red lines mark the cutoff for genome-wide significance (P < 10−10). Ticks at the bottom denote the locations of the genes encoding each RNA. U1 is encoded on chromosomes 3, 11, and 12.
(B) RAP-DNA enrichment versus input across a region containing several active genes (chr18: 34,313,699–35,191,532). RNA sequencing of input total RNA shows relative gene expression.
(C) Scatterplot shows Malat1 RAP-DNA enrichment versus levels of chromatin-associated RNA for single-exon histone genes (purple), single-exon non-histone genes (red), and all other genes (dark gray). Dashed lines represent linear regressions. R = Pearson’s correlation.
(D) RAP-DNA enrichment averaged over active genes (black), inactive genes (blue), and active genes in cells treated with flavopiridol (black dashed line). Shaded regions represent 95% confidence intervals for the average enrichment. For Malat1, the averages represent the 5% of active genes with the highest Malat1 enrichment and an equal number of randomly selected inactive genes.
(E) Same as (C) for U1 RAP-DNA.
(F) Same as (D) for U1 RAP-DNA. For U1, average enrichments include all active and inactive genes. Notable peaks occur at the transcription start site (TSS) and at the polyadenylation site (PAS). See also Figure S4.

