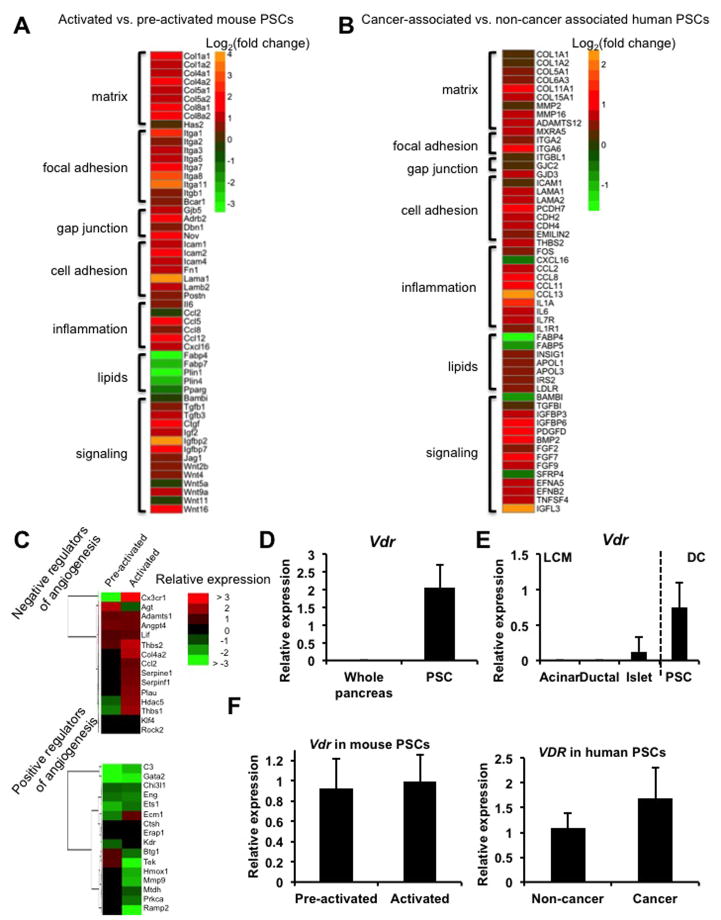
Figure 1.
Activated and cancer-associated PSCs exhibit a pro-fibrotic, pro-inflammatory phenotype. (A) Heatmap representing selected genes from RNA-Seq analysis of primary mouse PSCs, demonstrating gene categories with altered expression during activation. Data are represented as log2 fold change, activated (day 7) vs. pre-activated (day 3), n=3 per group. (B) Heatmap representing selected genes from RNA-Seq analysis of primary human PSCs, isolated from PDA patients (n=5) or cancer-free donors (n=4) and cultured for 15 days to achieve adequate yield and purity, expressed as log2 fold change PDA vs. cancer-free. (C) Heatmap showing the relative abundance of negative (top) and positive (bottom) regulators of angiogenesis in pre-activated and activated primary mouse PSCs. (D) Vdr expression in mouse whole-pancreas homogenates and in isolated PSCs, cultured for 3 days to expand and purify, as measured by qRT-PCR. (E) Vdr expression in the indicated pancreatic populations by qRT-PCR (normalized to 36B4; n=5). Acini, ducts, and islets were isolated by laser capture microdissection (LCM); PSCs were isolated by density centrifugation (DC). (F) Vdr expression in pre-activated and activated mouse PSCs (left) and in human non-cancer associated and cancer-associated PSCs (right) determined by qRT-PCR (normalized to 36b4, n=3). Bars indicate the mean; error bars indicate SD.

