Figure 2.

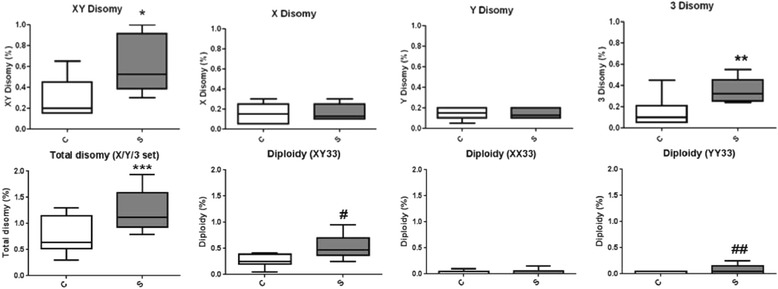
Comparisons between the percentage of disomies and diploidies in sperm of controls (C) and smoking (S) groups. (*) P < 0.0001, (**) P < 0.01. (***) P < 0.0001, (#) P < 0.0002 and (##) P < 0.0167.

Comparisons between the percentage of disomies and diploidies in sperm of controls (C) and smoking (S) groups. (*) P < 0.0001, (**) P < 0.01. (***) P < 0.0001, (#) P < 0.0002 and (##) P < 0.0167.