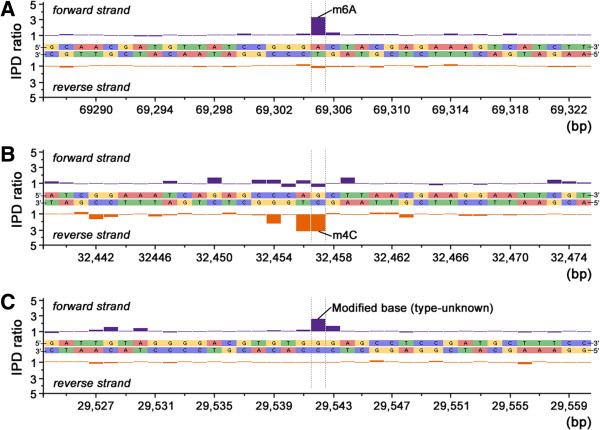
Figure 3.

Trace of IPD ratio variations showing three instances of modified sequence regions in the PaP1 genome. (A) IPD ratios of an m6A and its surrounding bases. (B) IPD ratios of an m4C and its surrounding bases. (C) IPD ratios of an unknown modified base and its surrounding bases.
