Figure 3.

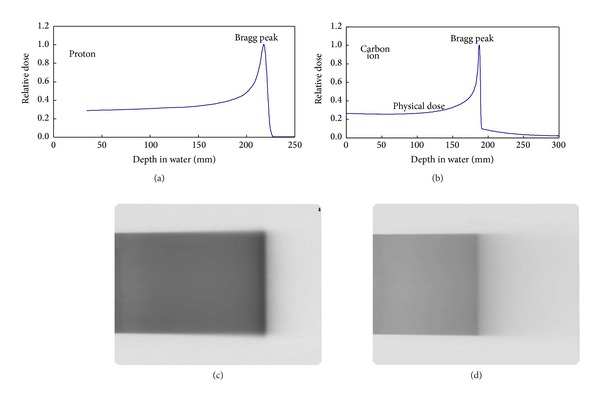
Differences in the dose distributions of proton ((a), (c)) and carbon ion ((b), (d)) monoenergetic beams ((a), (b) calculated and measured depth-dose curves; ((c), (d)) film densitometry).

Differences in the dose distributions of proton ((a), (c)) and carbon ion ((b), (d)) monoenergetic beams ((a), (b) calculated and measured depth-dose curves; ((c), (d)) film densitometry).