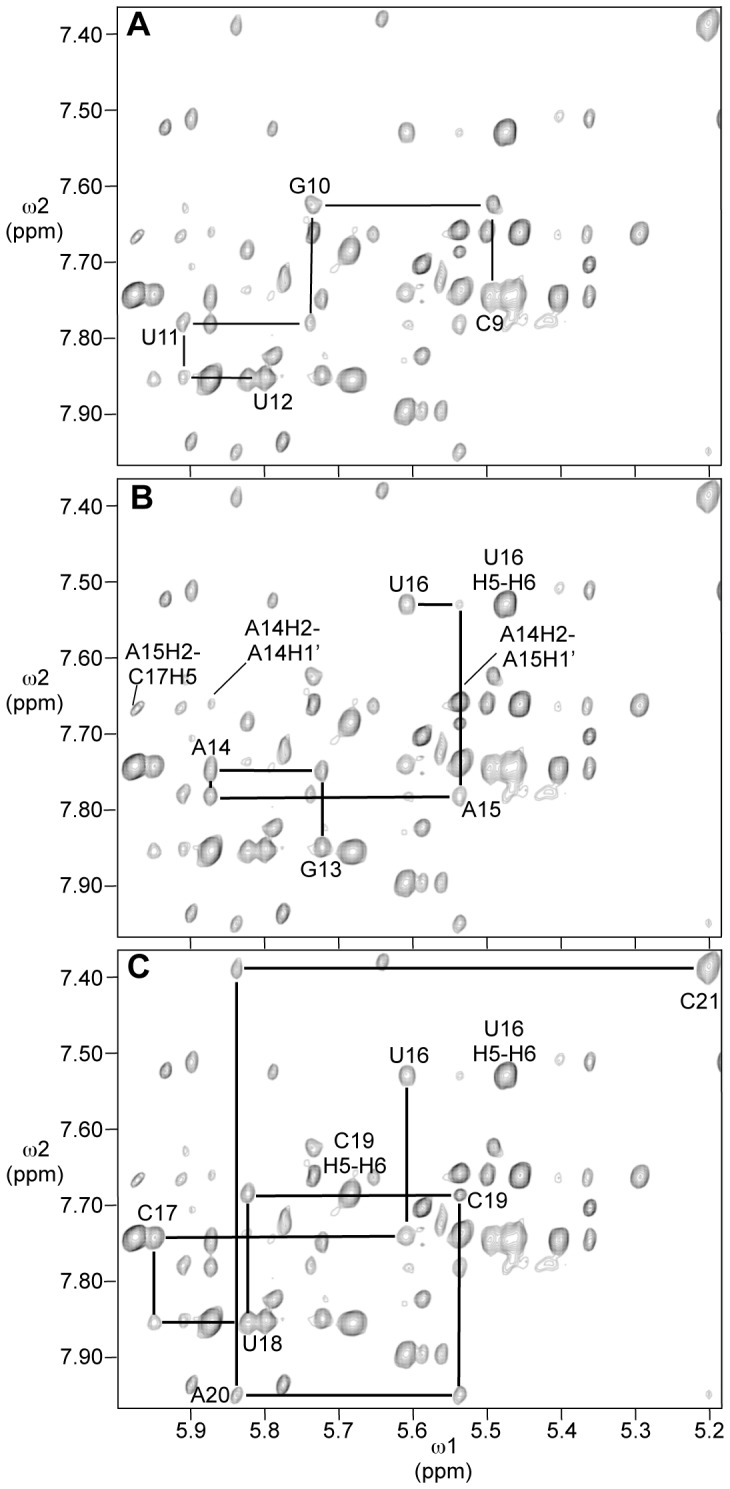
Figure 6. Portion of the NOESY spectrum showing NOEs between H8/H6/H2 (7.4–8.0 ppm) and H1′/H5 (5.2–6.0 ppm) protons.

Mixing time was 400 ms and temperature was 25°C. Cross-peaks due to NOEs from a nucleotide aromatic proton to the H1′ proton of its own sugar are labeled. A. Sequential NOEs from C9 to U12. B. Sequential NOEs from G13 to U16. Crosspeaks due to H2 of A14 and A15 and the U16 H5 to U16 H6 are labeled. C. Sequential NOEs from U16 to C21.
