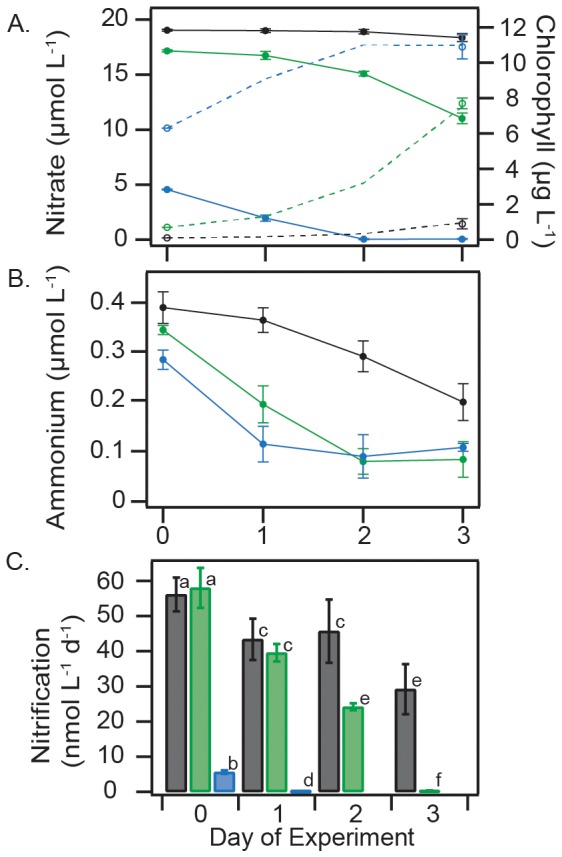
Figure 1. Results of multiday competition experiment showing the time-course of NO3−, chlorophyll and NH4+ concentrations and nitrification rates.

(A) Concentrations of NO3− (solid lines) and chlorophyll (hashed lines) in ‘surface’ (blue), ‘deep’ (black) and ‘bloom’ (green) treatments; (B) NH4+ concentrations; (C) and nitrification rates. Error bars (standard deviations of triplicate samples for all data except nitrification rates in ‘deep’ which are duplicates) are included on all data points, but in many cases are smaller than the symbols. Letters in panel (C) denote statistically supported differences in groups of means (t-test, P<0.05), the same letter on separate bars denotes rates that were not statistically different.
