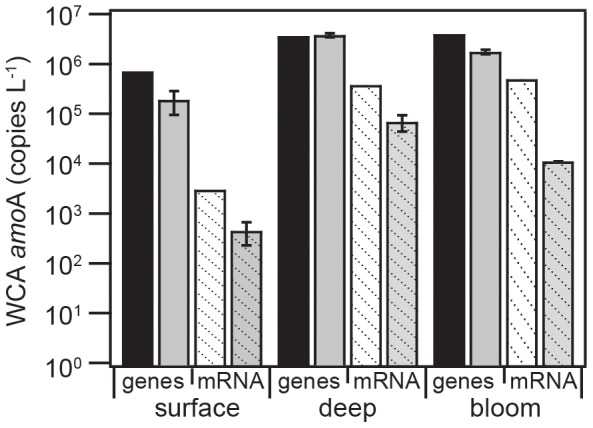
Figure 2. The abundance of WCA AOA amoA genes (solid bars) and mRNA transcripts (hashed bars) at the beginning (black for DNA, white for RNA) and end (gray) of the multiday experiments.

Initial time points from the start of the experiment were not replicated. End time points, taken on Day 3, are presented with error bars representing the standard deviation about the mean of triplicate (‘surface’ or ‘bloom’) or duplicate (‘deep’) samples. Gene and transcript abundances obtained by qPCR were normalized to the volume of seawater filtered.
