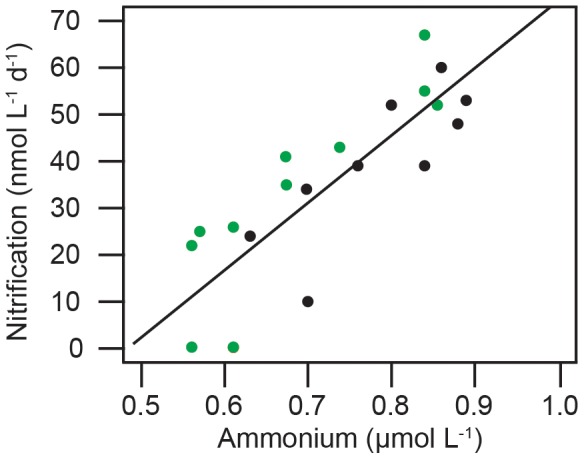
Figure 3. Regression plot showing the linear relationship between nitrification rates and ammonium concentrations (ambient + 15N tracer) in the ‘deep’ (black) and ‘bloom’ (green) treatments during multiday experiments.

Data from ‘surface’ are not included because rates were no longer detectable after Day 1 of the experiment. The fit was found to be significant (P<0.01, R2 = 0.72).
