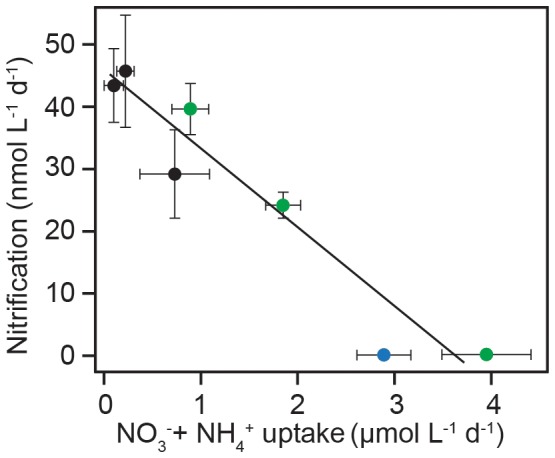
Figure 4. Regression plot of NH4++NO3− uptake rates, ascertained from differences between incubation days (enclosures) and nitrification rates on days 1–3 in ‘deep’ (black) and ‘bloom’ (green) and on Day 1 in ‘surface’ (blue), because rates were undetectable thereafter.

Error bars represent the standard deviation about the mean of independent and dependent variables. The line of best fit has a slope (±S.D.) of −12.7±1.7 and intercept (±S.D.) of 45.3±3.5. The fit was found to be significant (P<0.01; R2 = 0.93).
