
Figure 3.
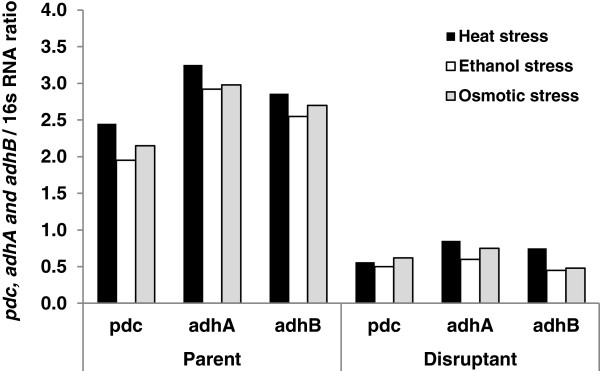
Expression levels of pdc, adhA, and adhB genes in Z. mobilis TISTR548 and Z. mobilis Δgfo under heat, ethanol, and osmotic stresses after real-time RT-PCR analysis. Values presented as the mean and relative expression levels of each gene as described in the Methods section.