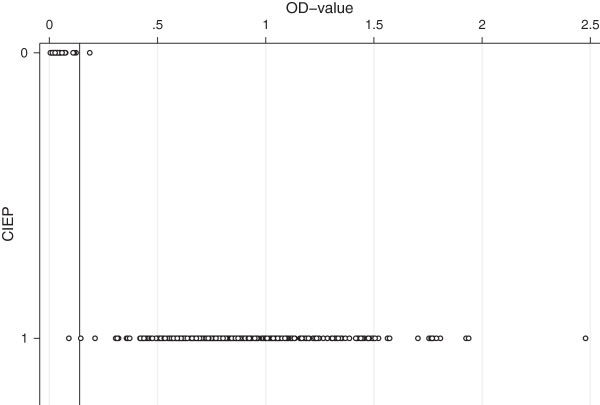
Figure 2.

The individual OD450 values obtained by the VP2 ELISA sorted by CIEP result. The X axis shows the CIEP result (0 = negative and 1 = positive) and the Y axis the OD450 value for each of the 366 samples. The calculated cut-off value is marked by the horizontal line.
