Figure 5.

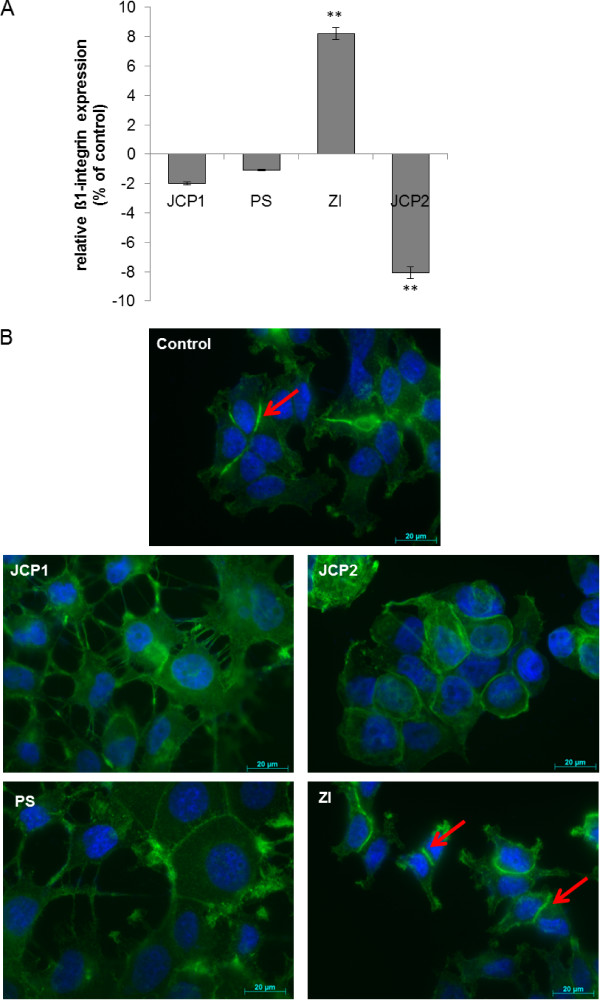
Monitoring of adhesion related proteins. A: Cell membrane associated (cell surface) β1-integrin expressions of plant extract treated (10 μg/ml) MCF-7 cells in percent of control measured by flow cytometry. As control DMSO treated cells were used. (mean ± SD, n = 3, **P < 0.01, *P < 0.05, significantly different compared to control, unpaired t-test). B: Fluorescence microscopy of F-actin (green) alterations after treatment with 10 μg/ml of the plant extract. Nuclei are marked in blue. Arrows point to the increased actin accumulation at sides of cell-cell contacts.
