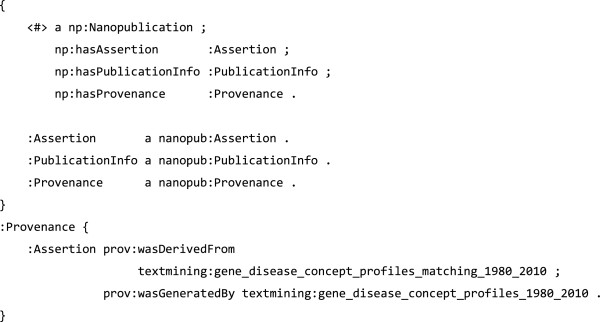
Figure 10.

Gene disease nanopublication example, in TriG format, adapted from [40]. The nanopublication is expressed as three named graphs: the Assertion which expresses the claim of this nanopublication (Figure 11), the PublicationInfo, which details the attributions of this assertion (Figure 12), and Provenance, relating this nanopublication to the original data it was derived from (shown above).
