Figure 5.

Relative (black lines) and cancer-specific mortality (grey lines) for soft tissue patients overall (a) as well as stratified by stage at diagnosis (b-c) with 95% confidence interval.

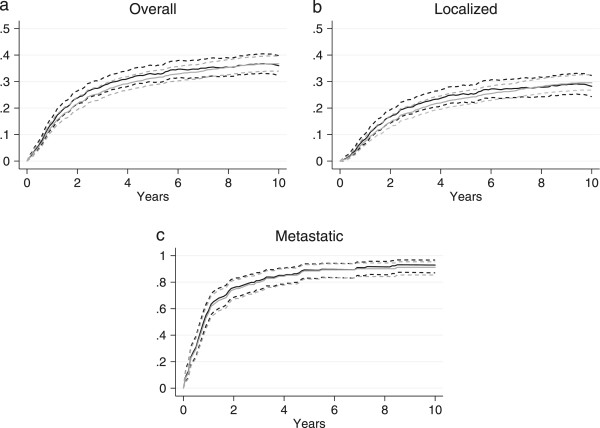
Relative (black lines) and cancer-specific mortality (grey lines) for soft tissue patients overall (a) as well as stratified by stage at diagnosis (b-c) with 95% confidence interval.