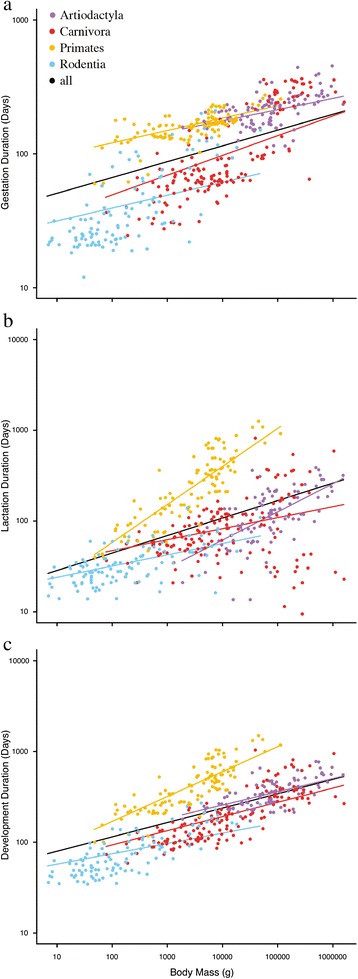
Figure 1.

Plots of (A) gestation duration, (B) lactation duration, and (C) total development time vs adult body mass for 457 mammalian species. Durations in days. Body masses in grams. Each point represents a species mean. Note log-transformed axes. Regression lines are the phylogenetically-controlled best fit lines calculated using PGLS.
