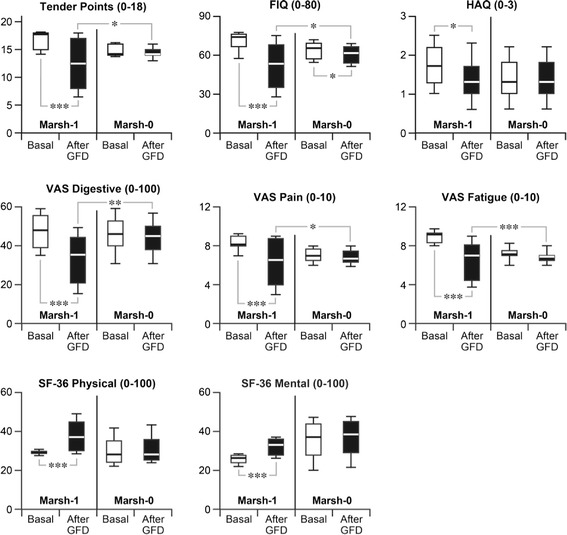
Figure 1.

Comparative results of clinical evaluation tests in Marsh stage 1 vs . stage 0 patients, at baseline and after one year of GFD. FIQ, Fibromyalgia Impact Questionnaire; GFD, gluten-free diet; HAQ, Health Assessment Questionnaire; Marsh-1, lymphocytic enteritis; Marsh-0, normal mucosa; SF-36, Short Form Health Survey; VAS, Visual Analogue Scale. In the box-and-whisker plots, the box is delimited by the 25th and 75th percentiles, the horizontal line within the box marks the 50th percentile (median), and the whiskers indicate the 10th and 90th percentiles. *** P <0.0001; ** P < 0.001; * P <0.05.
