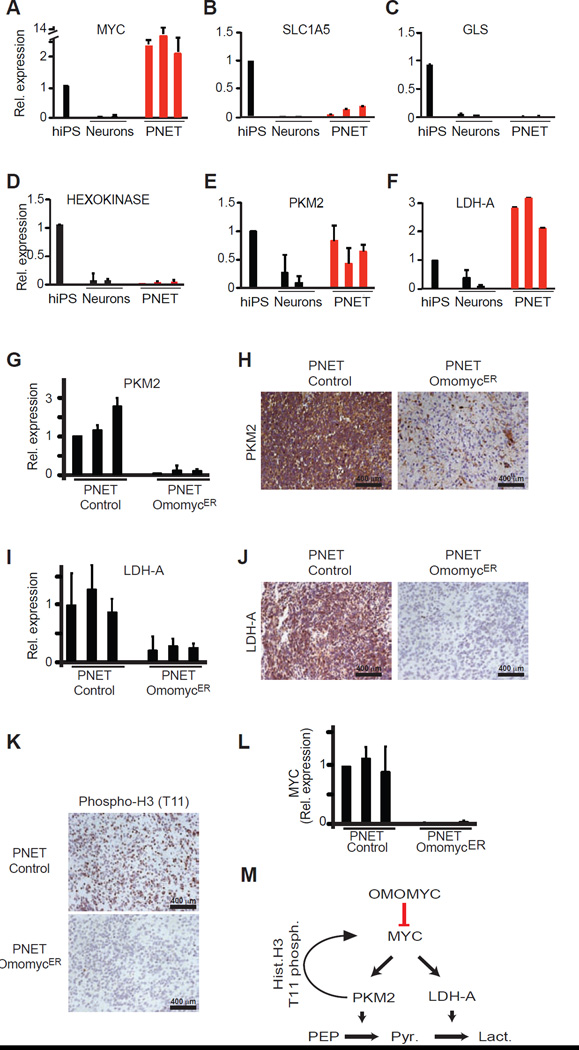
Figure 4. OmomycER sensitive changes in PKM2 and LDH-A expression distinguish PNETs from differentiated neurons.
A, Quantitative RT-PCR measuring relative expression of MYC in human iPS cells (hiPS), dopaminergic neurons (Neurons), and brain tumors (PNETs); B–F, Quantitative RT-PCR measuring relative expression of the indicated genes (glutamine transporter SLC1A5) (B), glutaminase (GLS) (C), hexokinase (D), pyruvate kinase M2 isoform (PKM2) (E), lactate dehydrogenase A (LDH-A) (F); G and H, Quantitative RT-PCR (G) and immunohistochemistry (H) measuring LDH-A mRNA and protein expression in control and OmomycER PNETs following in vivo tamoxifen treatment; I and J, Quantitative RT-PCR (I) and immunohistochemistry for LDH-A in control and OmomycER PNETs following treatment; K, Immunohistochemical stain for histone H3 (T-11 phosphorylation) in control and OmomycER PNETs after tamoxifen treatment in vivo; L, Quantitative RT-PCR measuring endogenous MYC expression in control and OmomycER PNETs after tamoxifen treatment in vivo. M, Diagram describing that OmomycER disrupts MYC and PKM2 dependent metabolic and transcriptional changes in cancer.

