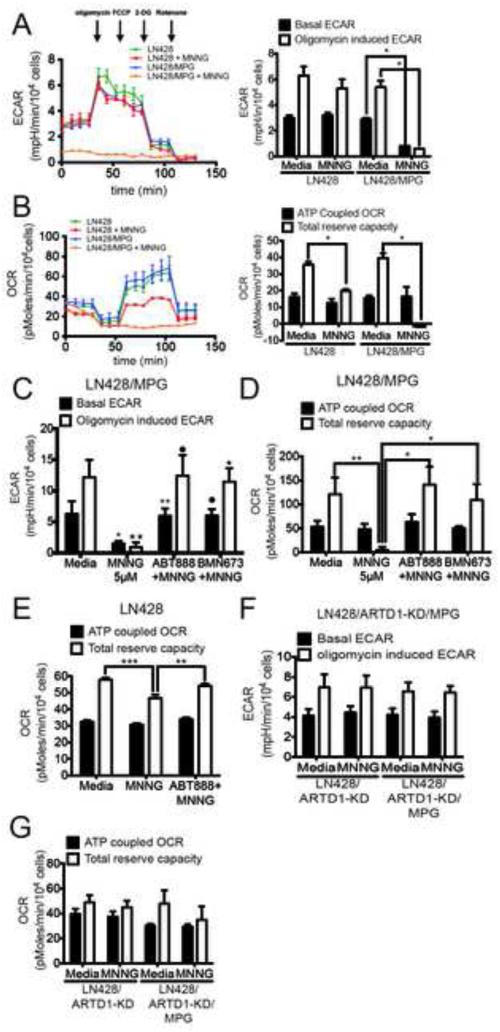
Figure 2. Mitochondrial dysfunction following alkylating agent-induced ARTD1 activation.
(A and B) Seahorse extracellular flux analyser (SEFA) measurement of ECAR metabolic profile (A) or OCR metabolic profile (B) in LN428 or LN428/MPG cells treated with either media or MNNG (5μM, 1hr). Bar graphs representing basal ECAR and oligomycin induced ECAR (A) or ATP coupled OCR and total reserve capacity (TRC) (B) are shown on the right. Traces shown are the mean of two independent experiments in which each data point represents technical replicates of 5 wells each +/− SE. Basal and induced ECAR rates, ATP coupled OCR and TRC are calculated using the average of 3 data points collected for each metabolic inhibitor, +/− SD (*p<0.05). (C and D) ECAR measurements (C) and OCR measurements (D) in LN428/MPG cells treated with 5μM MNNG following pre-treatment with media control or ARTD1 inhibitors ABT-888 or BMN-673 as indicated. Shown is the mean of 3 independent experiments +/− SD as described above: (C)*p<0.05 compared to media for basal ECAR, •p<0,05 compared to MNNG for basal ECAR, **p<0.005 compared to MNNG for basal ECAR, ∗∗p<0.005 compared to media for induced ECAR, •p<0,005 compared to MNNG for induced ECAR, ∗p<0,01 compared to MNNG for induced ECAR; D*p<0.05, **p<0.01. (E) OCR measurement in LN428 cells treated with 5μM MNNG following pre-treatment with media control or ARTD1 inhibitor ABT-888. Shown is the mean of 3 independent experiments +/− SD (***p<0.0004 compared to media control for TRC, **p<0.002 compared to MNNG for TRC). (F and G) ECAR measurement (F) and OCR measurement (G) for LN428/ARTD1-KD or LN428/ARTD1-KD/MPG cells after treatment with media control or 5μM MNNG. Shown is the average of 3 independent experiments +/− SD as described above.

