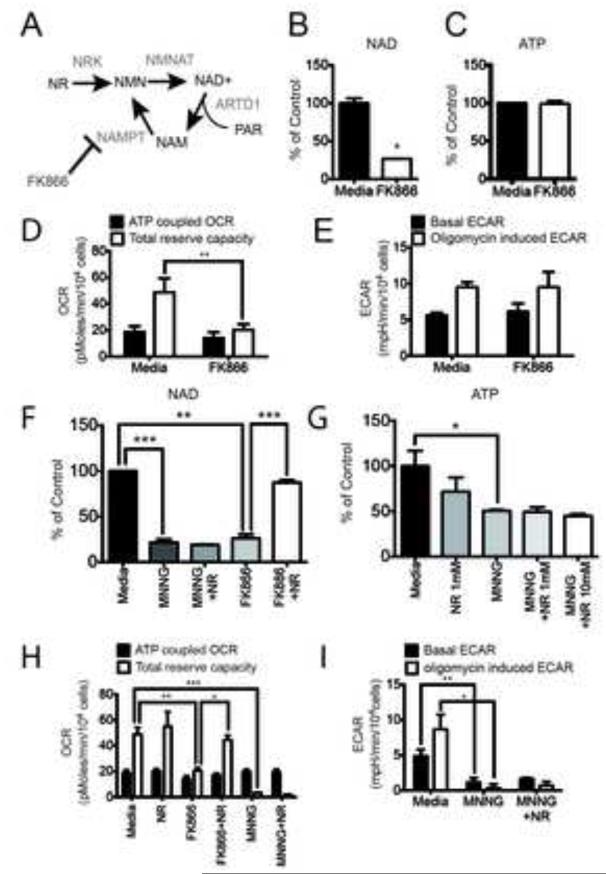
Figure 3. NAD+ depletion does not alter glycolysis in LN428/MPG cells.
(A) Schematic of NAD+ biosynthesis from Nicotinamide Riboside (NR) and from recycling after ARTD1 consumption of NAD+ releasing Nicotinamide (NAM). NAM is subsequently phosphorylated by Nicotinamide Phosphoribosyl Transferase (NAMPT), an enzyme selectively inhibited by FK866. (B and C) Global NAD+ (B) and global ATP (C) measurement in LN248/MPG cells after 24hr of treatment with media or FK866 (10nM). The data shown is the average of 3 independent experiments +/− SD and are reported as percentage of the untreated cells; (B)*p<0.05. (D) Seahorse measurement of the OCR metabolic profile was performed in LN428/MPG cells treated with either media control or FK866 (10nM) for 24hr. Shown is the mean of 4 independent experiments +/− SD (**p<0.01). (E) Seahorse measurement of the ECAR metabolic profile was performed as above. Shown is the mean of 2 independent experiments +/− SD. (F) Global NAD+ level in LN428/MPG cells after either media, NR (1mM) or FK866 (10nM) with or without NR (1mM) as a 24hr pre-treatment. Cells treated by MNNG, and pretreated or not by NR, are incubated 1hr with MNNG prior the analysis (***p<0.0005, **p<0.001). (G) Global ATP levels after 24hr treatment with either media (black bar) or NR (1mM) (dark grey bar), or NR (10mM) followed by media alone or media supplemented with MNNG (5μM, 1hr) (dark-grey, light-grey and white bars) (*p<0.05). (H) OCR metabolic profile of LN428/MPG cells treated with either media control or NR (1mM) and/or FK866 (10nM) followed by media alone or media supplement with MNNG (5μM, 1hr). Data shown is the mean of four independent experiments +/− SD (***p<0.005, **p<0.01, *p<0.05). (I) ECAR profile of LN428/MPG cells treated with either media or media supplemented with 1mM NR for 24hr followed by a 1hr treatment with MNNG. Data shown is the mean of three independent experiments +/− SD (**p<0.01, *p<0.05).

