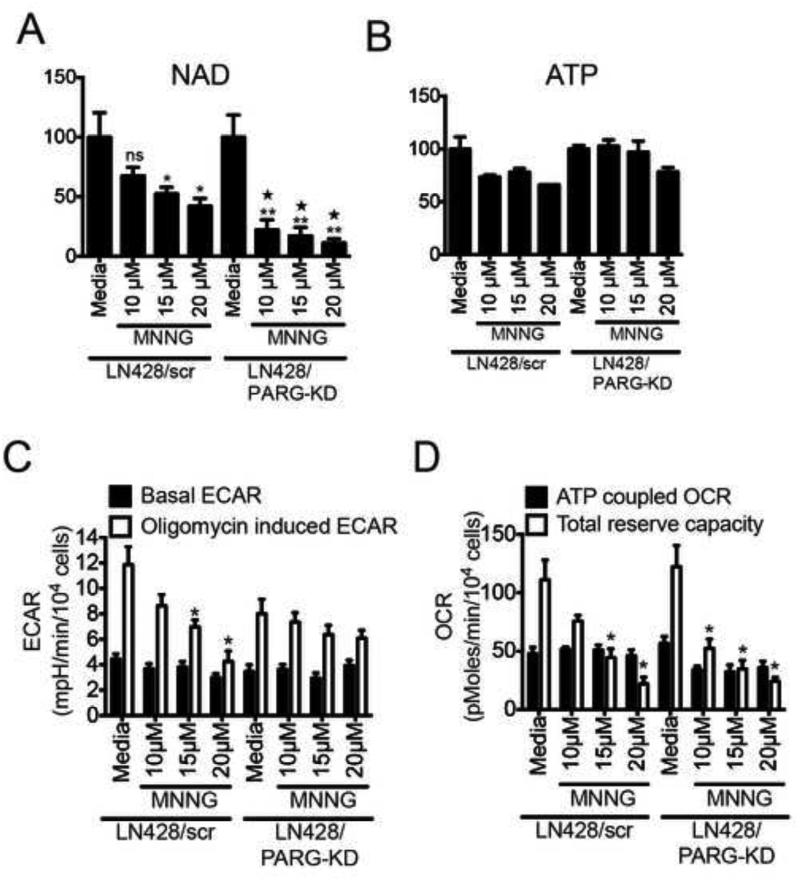
Figure 4. Absence of PARG rescues loss of ATP and glycolytic defects in LN428 cells after high dose MNNG treatment.
(A and B) Global NAD+ (A) and global ATP (B) measured in LN428/scr and LN428/PARG-KD cells after 1hr exposure to increasing doses of MNNG. Shown is the mean of 3 independent experiments (ns, non significant; *p<0.04 compared to media treated LN428/scr cells; **p<0,01 compared to media treated LN428/PARG-KD cells; ∗p<0.005 compared to each respective dose of MNNG in LN428/scr cells). (C and D) Seahorse measurement of ECAR metabolic profile (C) and OCR metabolic profile (D) of LN428/scr or LN428/PARG-KD cells treated with either media or MNNG (1hr) at 10μM, 15μM and 20μM. Shown is the mean of 3 independent experiments +/− SD (*p<0,05).

