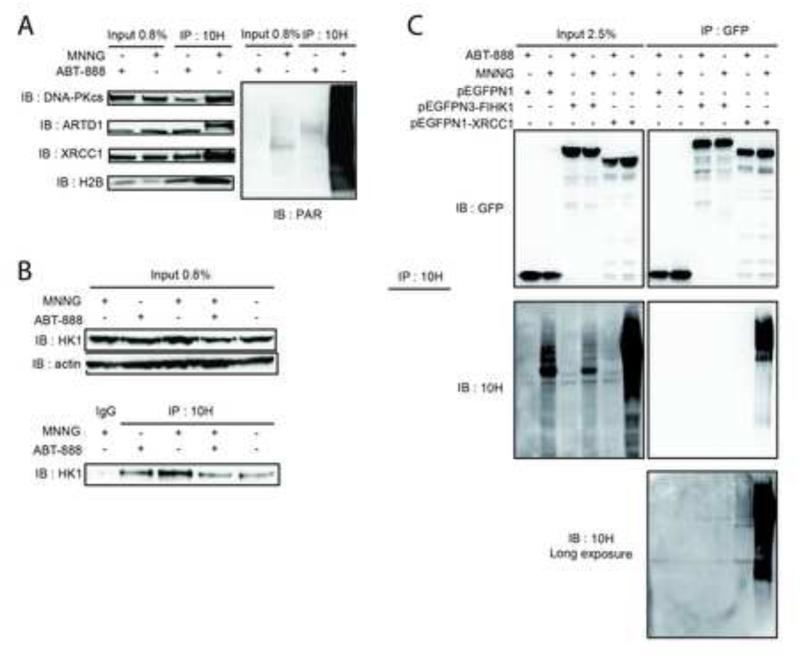
Figure 5. Affinity-purification and analysis of PAR-containing complexes.
(A) Validation by IP/immunoblot of DNA-PKcs, ARTD1, XRCC1 and H2B identified in the mass spectrometry analysis. Left panel is IP with the anti-PAR Ab 10H and immunoblot with the indicated antibodies; right panel is immunoblot for PAR after IP with the anti-PAR (10H) Ab. (B) Validation by IP/immunoblot of HK1 enzyme identified in the mass spectrometry analysis as described in (A). (C) Upper panel is the GFP immunoblot on inputs and IP samples after pull-down of GFP-tagged proteins with GFP-Trap. Cells are treated either with the ARTD1 inhibitor ABT-888 (10μM; 30min) or with MNNG (5μM; 5min). Lower panel is PAR immunoblot on inputs and IPs samples. PAR immunoblot on IPs samples is shown as short and long exposures.

