
Figure 2. Adjusted Resource Use by Hospital.
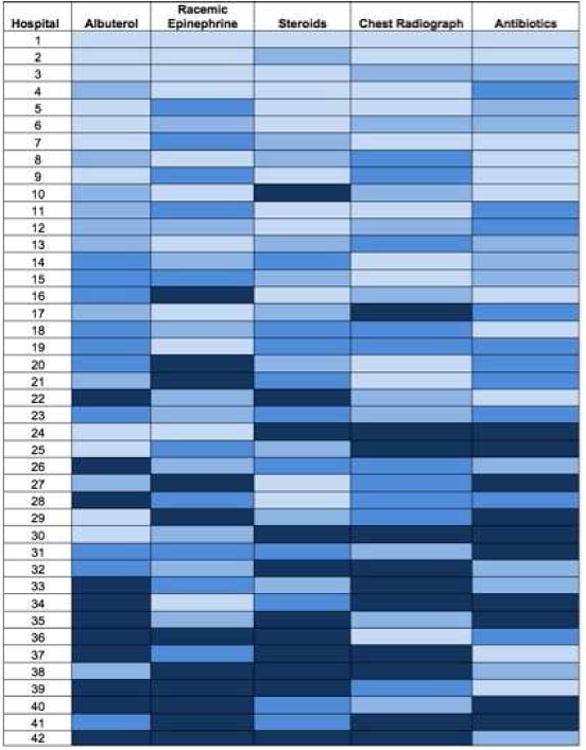
For each process listed on the horizontal axis, hospitals were ranked by their adjusted median use of the resource. Each box represents the adjusted rate of a single process at a single hospital; darker shading indicates higher adjusted rates of utilization for that process at that hospital. For each hospital, overall utilization was determined by summing that hospital’s adjusted utilization rates of the five processes. Hospitals were ordered according to their overall utilization rank, from low to high, on the vertical axis.