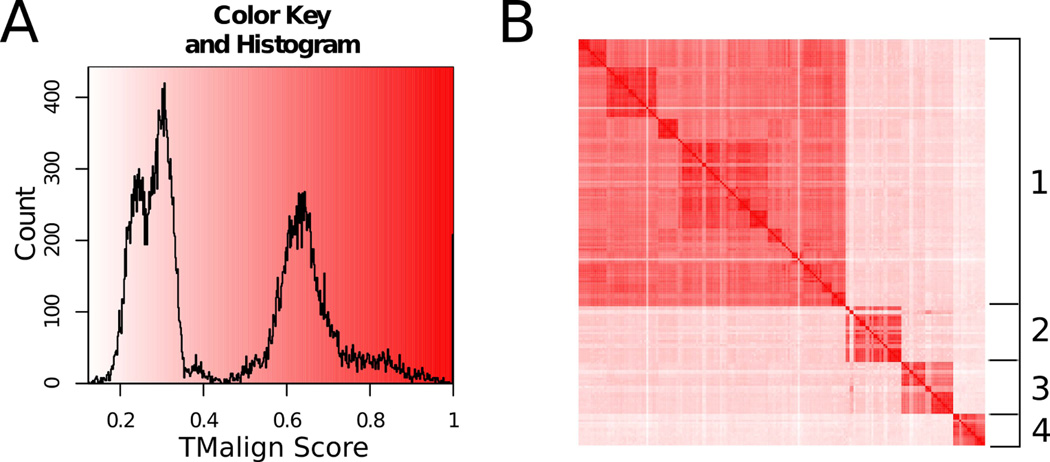
Figure 5. Structural alignment histogram and heat map.
(A) A histogram of the pairwise TMalign scores for the 204 PLP-dependent proteins in the dataset. The entire symmetrical score matrix was evaluated in 0.002 intervals to produce the plot. (B) A heat map of the corresponding TMalign score matrix used in (A). The white to red coloring scheme of the heat map corresponds to the score and gradient in the respective histogram. The order of the sequences is the same as in Table S1 and the associated network map is illustrated in Figure S2.

