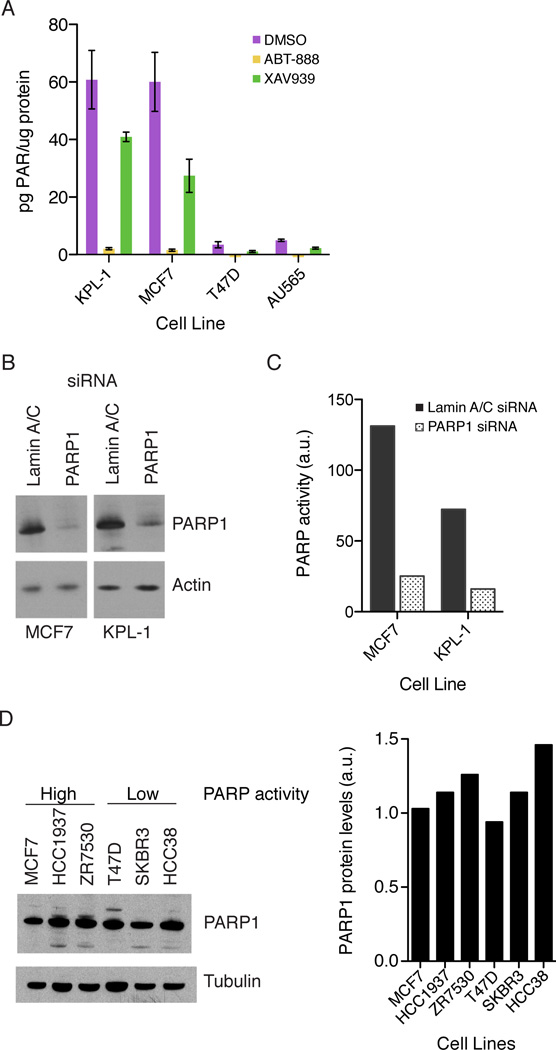
Figure 2. Differences in PARP activity result from PARP1 activation.
A) Cells were treated with DMSO (purple), 10uM ABT-888 (yellow) or 10uM XAV939 (green) for 2 hours and PAR accumulation in the lysates was measured. Total PAR is normalized by total protein in the lysates. Error bars show standard error with n = 6. B) PARP1 knock down in MCF7 and KPL-1 cells with Lamin A/C siRNA (Dharmacon) as a control. C) For PARP1 activity, control siRNA (solid bars) and PARP1 siRNA (open bars) lysates with equal amounts of total protein were incubated with 32P-NAD+ for 30 minutes. A representative experiment from 3 independent experiments is shown. D) PARP1 protein levels across the cell lines shown. Bands were quantified using ImageJ and PARP1 protein levels normalized by tubulin levels. See also Figure S2.

