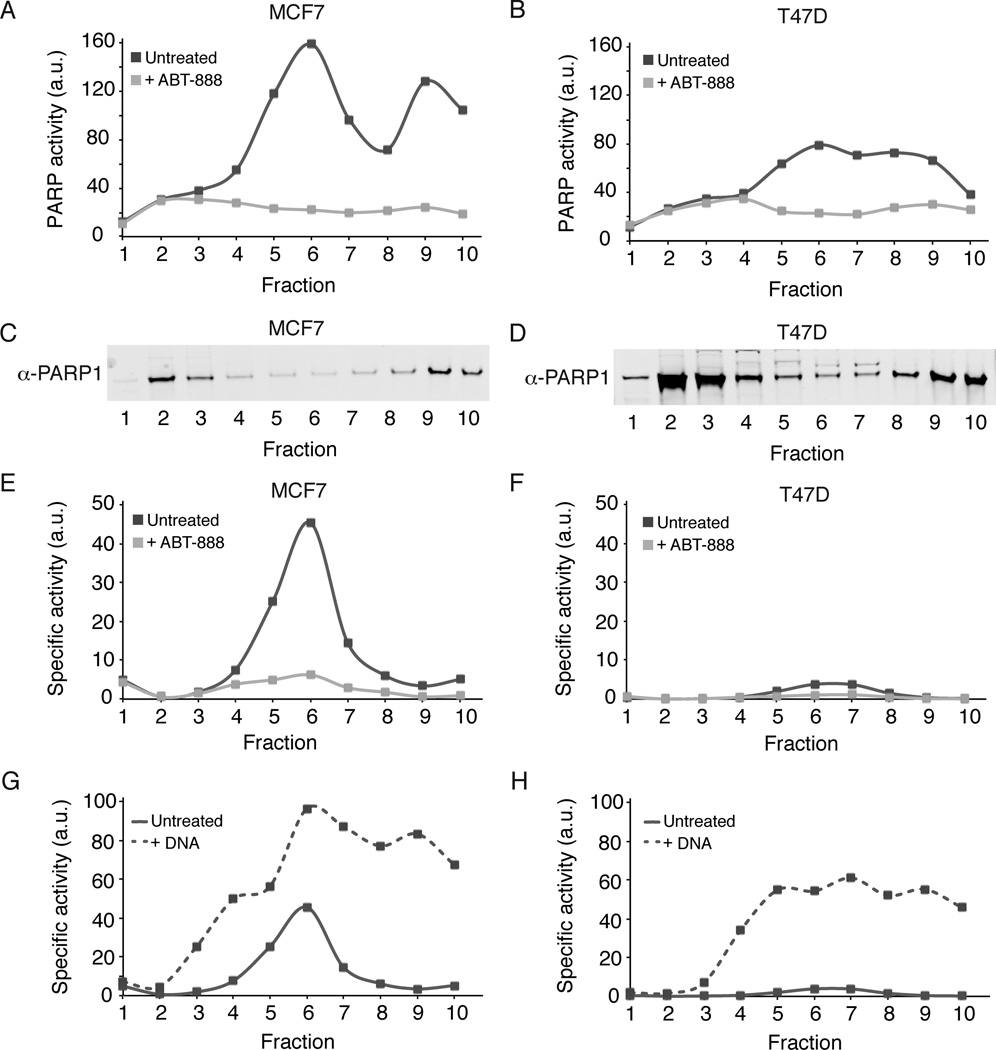
Figure 3. PARP1 is found in multiple biochemical states.
MCF7 (A, C, E, G) and T47D (B, D, F, H) lysates were fractionated using 5–40% sucrose gradients. A-B) Aliquots from each fraction were incubated with 32P-NAD+ for 30 minutes in the absence (solid dark grey line) and presence (light grey line) of 10uM ABT-888. C-D) Aliquots from the same sucrose gradient fractions were used for PARP1 immunoblots. E-F) PARP1 activity from panels A-B was normalized by PARP1 protein levels to give specific activity. Representative data from two independent experiments is shown. G-H) Aliquots from each fraction were incubated in the absence (solid line) or presence (dashed line) of 0.02 mg/ml knicked DNA. Specific activity was determined as in panels E-F. See also Figure S4.

