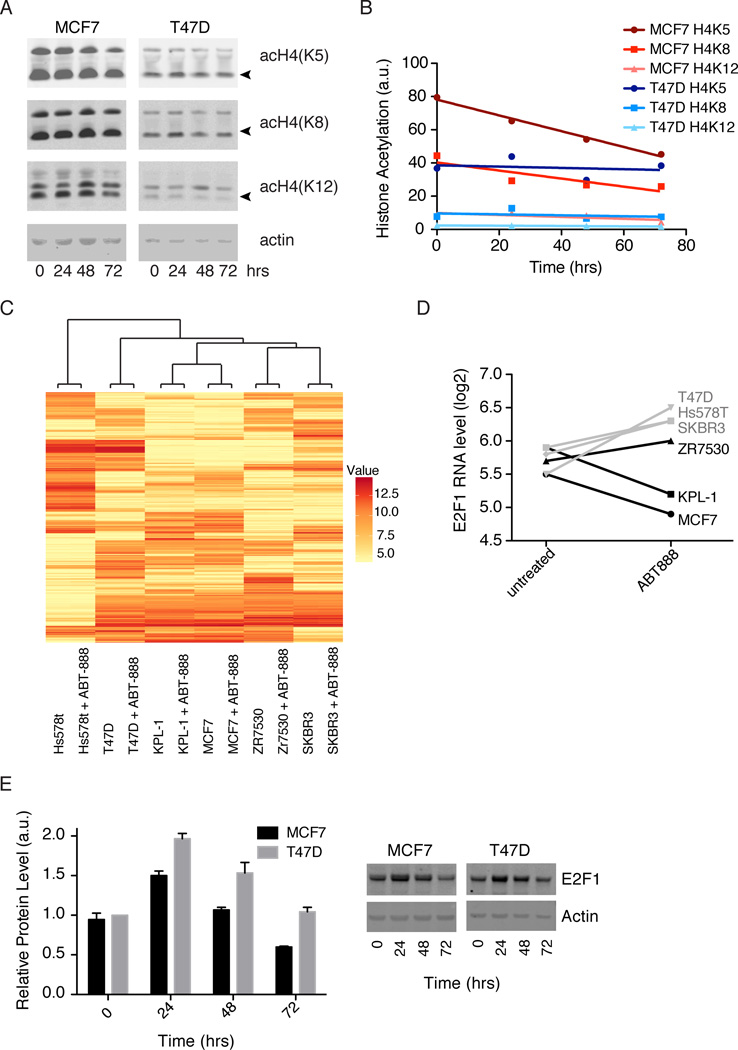
Figure 5. Effects of PARP1 activity on histone acetylation and transcription.
A) Histone acetylation at the indicated positions in MCF7 and T47D cells was measured by immunoblot after 0, 24, 48, and 72 hours of treatment with 10uM niraparib. DMSO was used for the 0 time point. B) Intensities of acetylated histones (marked with arrows in A) were quantified in ImageJ and normalized by actin. Normalized intensities were plotted and fit with straight lines. The slope of MCF7 H4K5, −0.48 ± 0.03, is significantly different from zero with R2 = 0.99 and p = .005. The other fits are not significantly different from zero with p > 0.1. Fitting done in Prism. C) Hierarchical clustering of the 500 genes with the largest standard deviation across all 12 samples. Cell lines were treated for 48 hours with DMSO or 10uM ABT-888 before transcript profiling. Values shown are log2(expression level) D) Log2(expression levels) for E2F1 ± ABT-888 in cell lines with low PARP activity (grey) and cell lines with high PARP activity (black). E) E2F1 protein levels, determined by immunoblot, after 0, 24, 48 or 72 hours of 10uM niraparib treatment. Intensities of E2F1 were quantified in ImageJ and normalized by actin. See also Figure S6 and Table S2.

