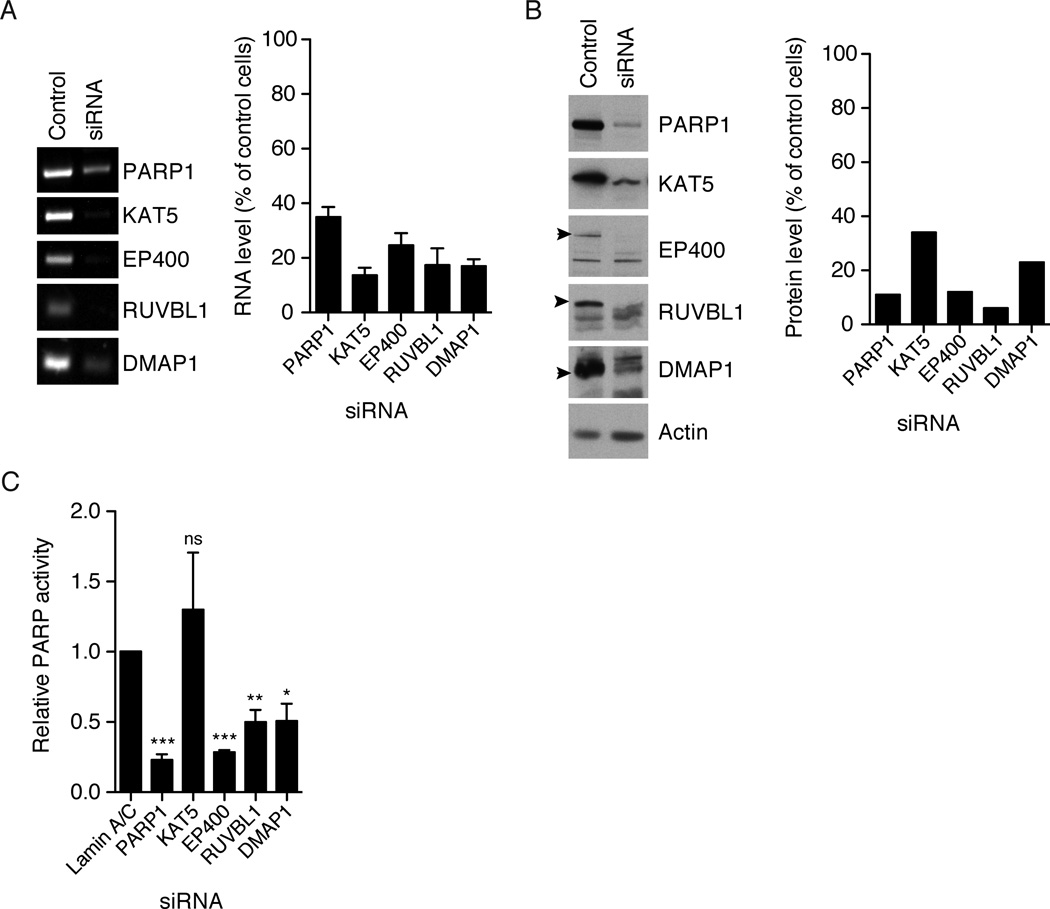
Figure 6. NuA4 components are required for PARP1 activity.
Proteins were knocked down by siRNA in MCF7 cells. A) Representative image of RT-PCR on control and siRNA treated cells with quantification of the results using ImageJ for background subtraction and band intensity measurements. Error bars show standard error and n=3. B) Protein levels in control and siRNA treated cells as measured by immunoblot, and quantification of the shown immunoblot using ImageJ. C) PARP1 activity measured by incubating lysates with 32P-NAD+ for 30 minutes. Samples were normalized by total protein concentrations and reported as fraction of activity as compared to the lamin A/C siRNA control. Error bars show standard error with n=4. A t-test (Prism) comparing each siRNA to the lamin A/C control, p values are *** = < 0.001, ** = 0.001–0.01, * = 0.01–0.05, ns = > 0.05.

