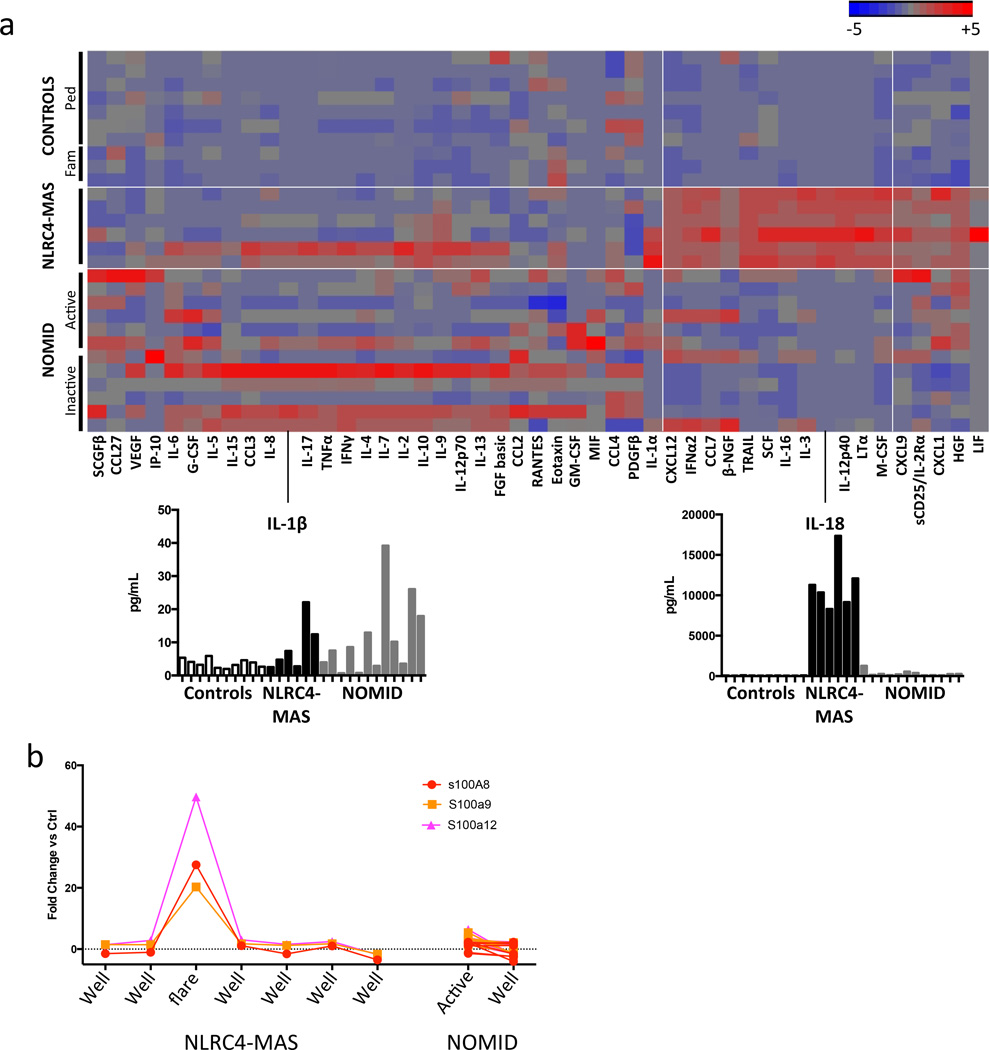
Figure 3. Peripheral blood signatures differentiate NLRC4-MAS from healthy controls and NOMID patients.
(a) We performed multiplex cytokine analysis on serum from the NLRC4-MAS patient, healthy pediatric controls, the patient’s family, and NOMID patients. NLRC4-MAS patient samples were obtained at seven distinct timepoints over the course of 10 months. Paired NOMID samples were obtained from six patients during both clinically active and inactive disease. No serum sample during a clinical flare from the NLRC4-MAS patient was available for cytokine analysis. Values represent the mean of two technical replicates per sample. Hierarchical clustering was performed on cytokine values normalized to the mean value across all samples. The magnitude of serum IL-1β and IL-18 concentrations are shown below. Horizontal white lines separate disease groups and vertical white lines indicate cytokines that form the NLRC4-MAS signature. (b) Whole blood transcriptional analysis of S100A genes from the NLRC4-MAS patient and matched samples from seven NOMID patients during active or inactive disease. All patient values are expressed as Fold Change (FC) above or below the average expression in 5 healthy controls.

