Figure 6.

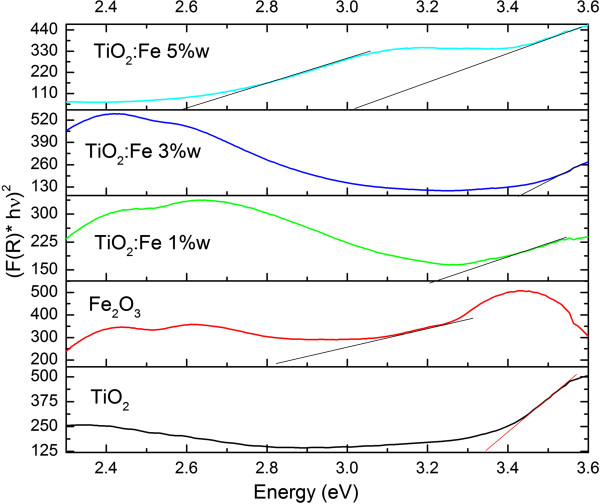
Kubelka-Munk transformed reflectance spectra of the samples TiO 2 , Fe 2 O 3 , and TiO 2 :Fe 2 O 3 at different Fe weight percentages.

Kubelka-Munk transformed reflectance spectra of the samples TiO 2 , Fe 2 O 3 , and TiO 2 :Fe 2 O 3 at different Fe weight percentages.