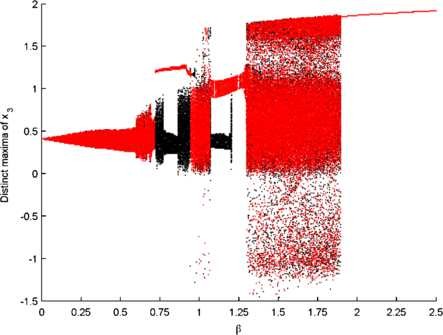
Fig. 4.

Effect of coupling strength. Scan of the dynamics of the 3 compartment model over changes in the coupling strength, β. The distinct maxima of are shown, with black and red dots denoting forward and backward scans, respectively. All other parameters are as in Fig. 2
