
Fig. 6.
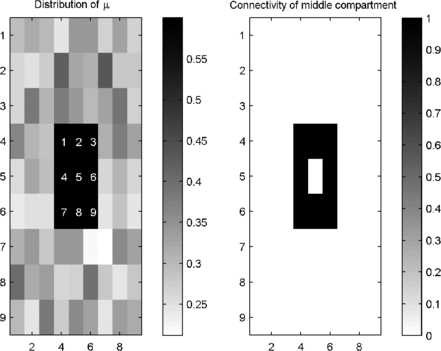
Schematic of a system with nearest neighbour coupling. Layout of the system of coupled compartments. Left: colour coded image of the distribution of μ. The central 9 squares have , whereas the rest of the system has μ drawn from a normal distribution with mean 0.3 and variance 0.05. Numbers indicate compartment labels for reference. Right: demonstration of connectivity for the central compartment. Black indicates the presence of connections