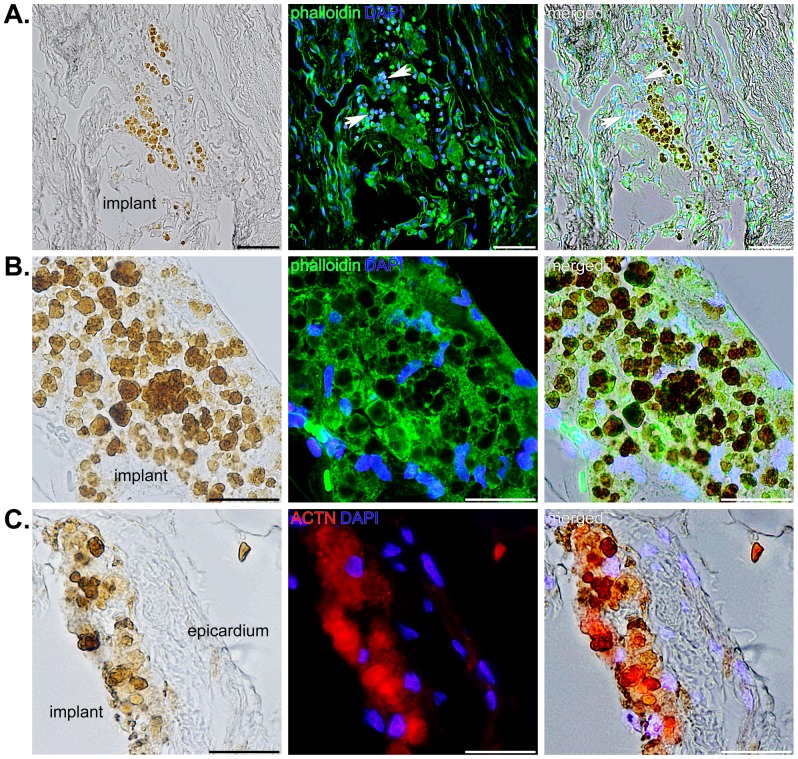
Figure 6. SPIO nanoparticle-labeled cells located within the implant in three different hearts.
A) Brightfield, fluorescence, and merged images showing iron deposits in progenitor cells contained within the implant (left panel), staining of filamentous actin with phalloidin (green) and DNA (blue) (middle panel) in the same section, and the merged image (right panel). Arrows indicate a few inflammatory cells that are not positive for iron. Scale bars equal 50 µm. B) A different heart showing heavily-labeled cells in the implant using the same staining as described for A). Scale bars equal 25 µm. C) Iron was also evident (brown) within a portion of the implant immediately adjacent to the right ventricular epicardium in a separate tissue section (left panel) that was immunostained for ACTN (red) and DAPI (blue) (middle panel). The right panel shows an overlay of the two images to the left. Scale bars equal 25 µm.

