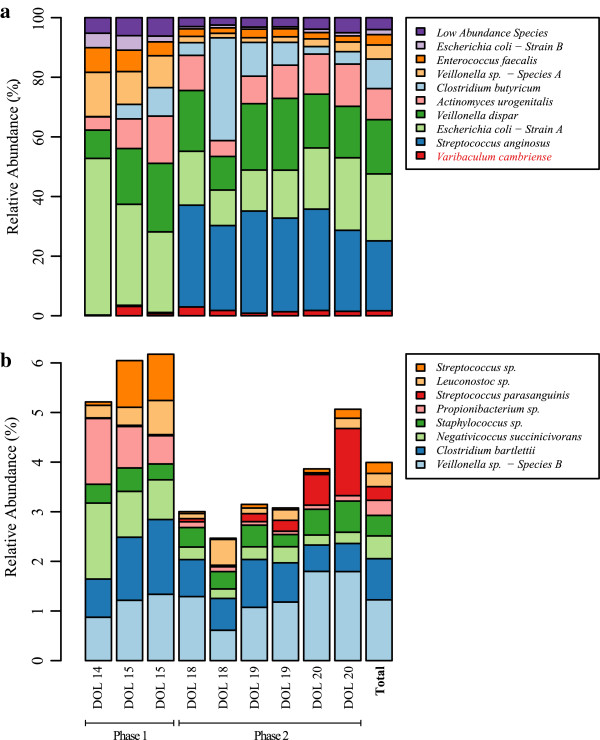
Figure 3.

Relative abundance of bacterial species over time. Relative abundances were calculated for bacterial species at nine different time points during the third week of life of a premature male infant. (a) Shows dominant taxa and (b) shows low-abundance species across the time series. During this period, the colonization process is defined by two distinct phases based on the dominance of either facultative (phase 1) or obligate (phase 2) anaerobes.
