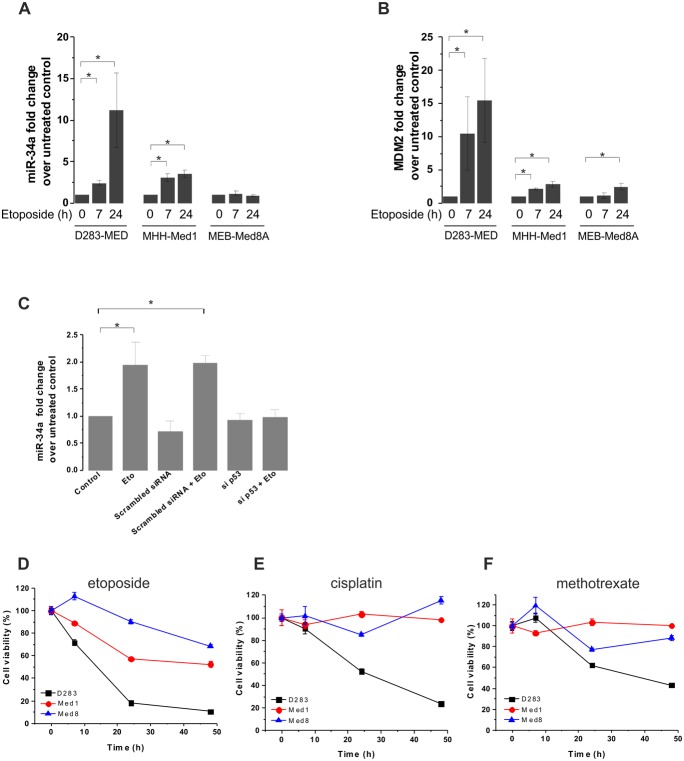
Figure 1. MB cell lines display different levels of MiR-34a induction, which correlate with sensitivity to chemotherapeutic drugs.
(A, B) D283-MED, MHH-Med1 and MEB-Med8A cells were treated with [20 µM] etoposide for indicated time points and levels of miR-34a (A) and Mdm2 mRNA (B) were assessed by real time qPCR. Results were normalised to cyclophilin A and fold changes relative to the untreated control. See also Fig. S1A for a DMSO control. (C) D283-MED cells were transfected with siRNA directed to p53 or with non-specific siRNA as a negative control for 48 hours prior to etoposide treatment. The levels of miR-34a were assessed by qPCR as in (A). Data shown are the mean ± S.E.M of three independent experiments. (A–C) Kruskal-Wallis ANOVA test was performed (*indicates p<0.05). (D–F) Cell viability of D283-MED, MHH-Med1 and MEB-Med8A was measured by MTS assay upon treatment at indicated time points. (D) Etoposide [20 µM] (E) cisplatin [5 µM] (F) methrotrexate [5 µM]. The percentages of viable cells were relative to the untreated control. See also Fig. S1B for a vehicle DMSO control on cell death. Data shown are the mean ± S.E.M of three independent experiments.

