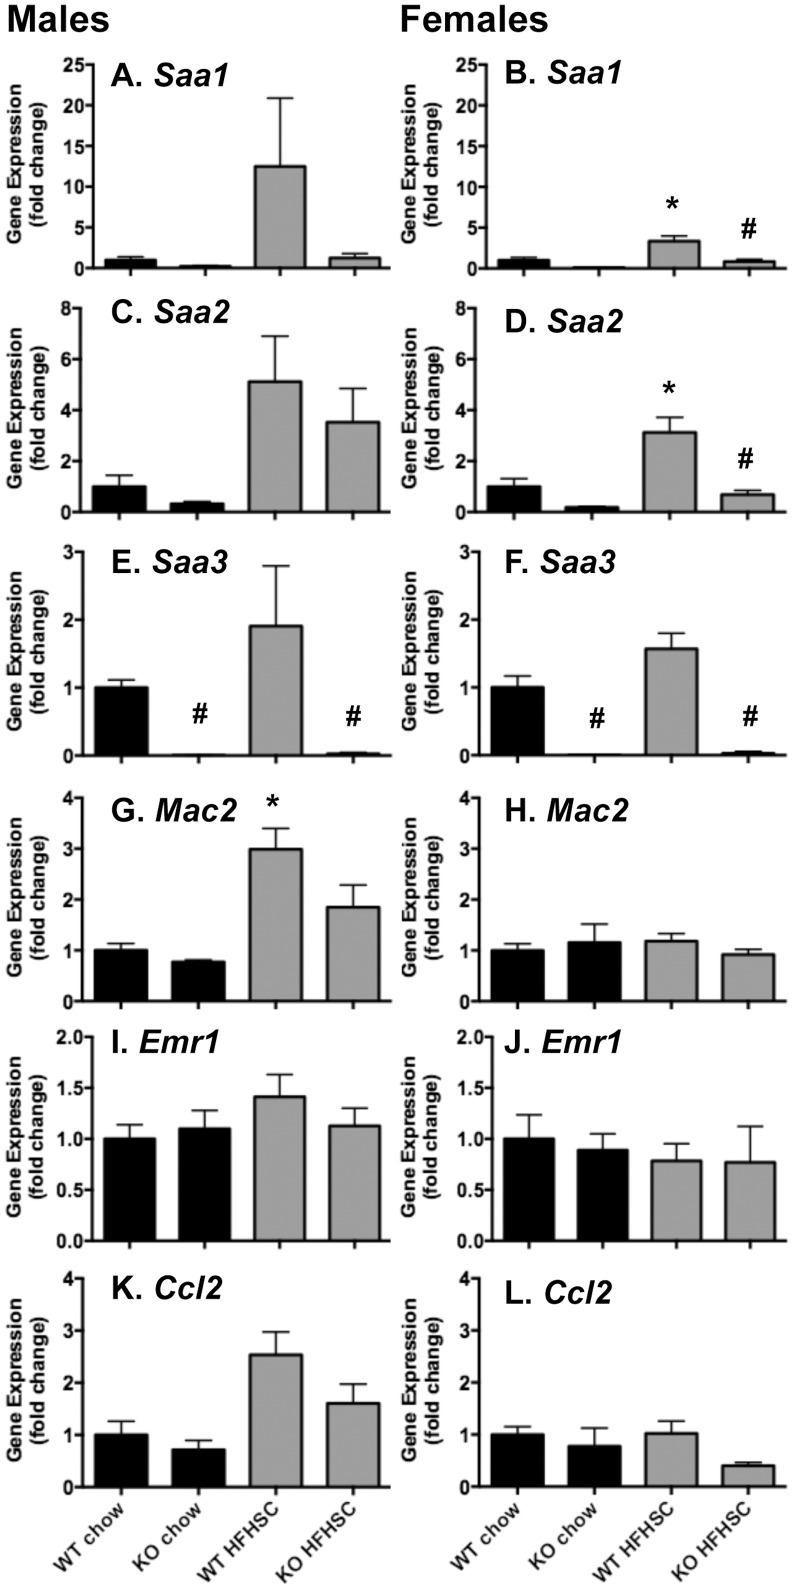
Figure 5. Liver Saa1 and Saa2 are attenuated in Saa3 −/− mice.
Total RNA from whole liver was reverse transcribed into cDNA for quantitative PCR analysis. Genes including Saa1 (A–B), Saa2 (C–D), Saa3 (E–F), Mac2 (G–H), Emr1 (I–J), and Ccl2 (K–L) are presented, normalized to an internal control gene (Gapdh) and presented as fold change from Saa3 +/+ chow controls. n = 6–15 mice per group. *P<0.05 from chow group; #P<0.05 from Saa3 +/+ controls. WT: Saa3 +/+; KO: Saa3 −/−.

