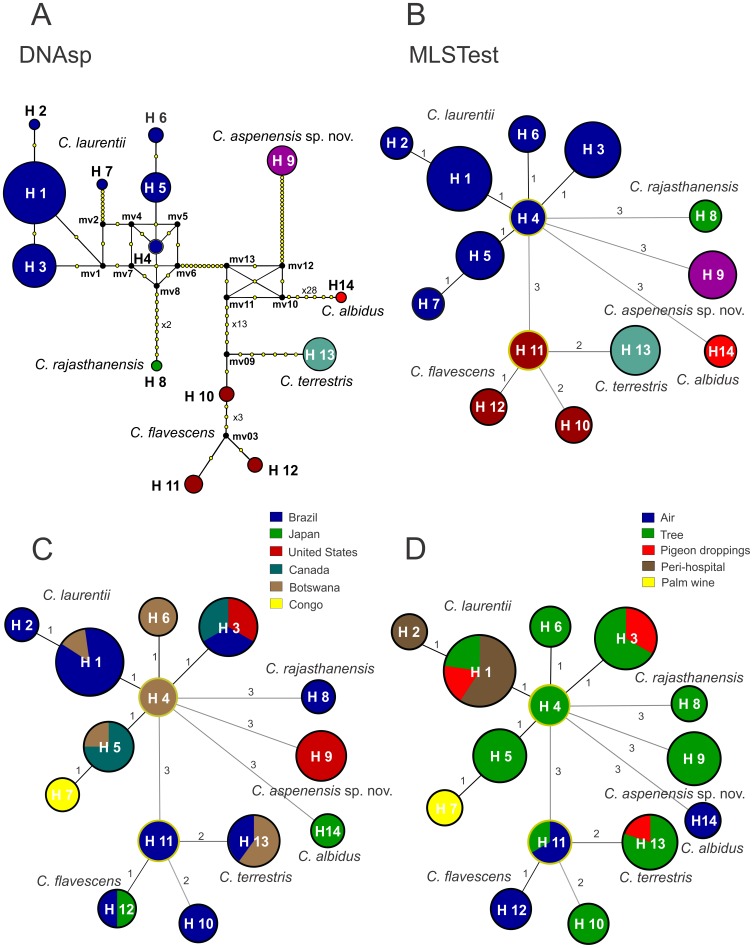
Figure 4. Median-joining haplotype network (A) of environmental C. laurentii isolates based on concatenated nucleotide sequences of the 5′ end of 18S-SSU, D1/D2 of 28S-LSU, and ITS regions.
The tree represents 103 Cryptococcus spp. isolates from Brazil, Botswana, Canada, Japan, India, and the United States. The seven C. laurentii and three C. flavescens haplotypes are clearly distinguished. The Botswana ancestral haplotype (H4) of C. laurentii is presented and highlighted in yellow. Each circle represents a unique haplotype (H), and the circumference is proportional to haplotype frequency (H1: 44 isolates; H2: 1; H3: 18; H4: 2; H5: 8; H6: 2; H7: 1; H8: 1; H9: 8; H10: 2; H11: 3; H12: 2; H13: 10; H14: 1; outgroup C. albidus CBS 142). Yellow dots represents the number of mutation sites, excluding gaps, between the haplotypes. Black dots (median vectors) are hypothetical missing intermediates. Minimum spanning trees (B) using the goeBURST algorithm confirm the haplotype relationships among C. laurentii isolates determined by median-joining network analysis. The size of the circle corresponds to the number of isolates within that haplotype, and the numbers between haplotypes represent the genetic distance of each haplotype, excluding the gaps. Minimum spanning trees as described in B modified to show the distribution of haplotypes according to the country of origin (C) or environmental source (D).

