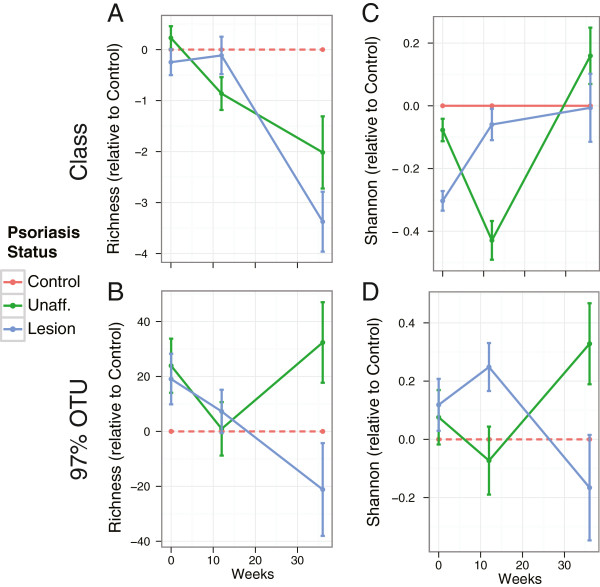
Figure 6.

α Diversity trends in the longitudinal cohort. For the longitudinal cohort, we show the α diversity ((A,B): richness, (C,D) Shannon) of unaffected (green) and lesion (blue) samples relative to the control group at the class level (A,C) and for 97% operational taxonomical units (OTUs) (B,D). At all timepoints, the data show no statistically significant intergroup differences in α diversity.
