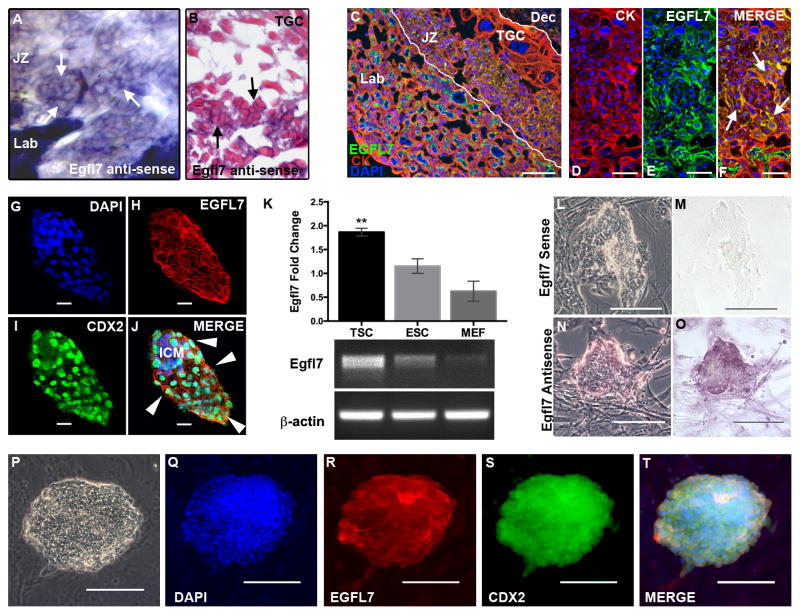
Figure 2. EGFL7 is expressed in the trophoblast cell lineage of the mouse.
In situ hybridization was performed to determine Egfl7 mRNA localization, using an Egfl7 riboprobe on 100μm thick vibratome sections of E10.5 C57Bl/6 placentas (A). Shown is the junctional zone of the placenta (A). Paraffin sections of the vibratome section showing cellular morphology of Egfl7 riboprobe staining in the junctional zone of the placenta (B). Arrows indicate positive Egfl7 transcript signal in the junctional zone trophoblast cells. (TGC=Trophoblast Giant Cell). To determine the cell type expressing EGFL7 protein in the placenta, double immunofluorescent staining was performed on E10.5 C57BL/6 placentas (C–F) for the pan-trophoblast marker, CYTOKERATIN (CK, red), EGFL7 (green), and nuclear DAPI (blue). Cross-section of E10.5 placenta showing the fetal labyrinth (Lab), junctional zone (JZ, demarked by white lines) and maternal decidua (Dec). High magnification images (D–F) of the junctional zone demonstrating colocalization of EGFL7 with CK in the JZ trophoblast cells (arrows). Whole mount immunofluorescent staining of blastocyst-stage C57BL/6 embryos (G–J) for DAPI (blue), EGFL7 (red), and trophectoderm cell marker, CDX2 (green) reveals EGFL7 protein localization to both inner cell mass (ICM) cells and trophectoderm cells (arrowheads). Real Time RT-PCR data for Egfl7 transcript expression in trophoblast stem cells (TSC), embryonic stem cells (ESC), and mouse embryonic fibroblasts (MEF), shows a significantly higher level of Egfl7 expression in TSC,**P<0.01 (K, top). Agarose gel with products of semi-quantitative RT-PCR for TSC, ESC and MEFs are shown, using Egfl7 and β-actin specific primers (K, bottom). RNA in situ hybridization analysis of Egfl7 mRNA in TSC (L–O) defines Egfl7 transcript expression in TSC. Phase-contrast and bright-field images of TSC incubated with an Egfl7 sense control probe (L–M), and an Egfl7 antisense probe (N–O). Double immunofluorescent staining of TSC (P–T) for DAPI, EGFL7, and CDX2 demonstrating EGFL7 protein localization to TSC. Phase-contrast image of TSC colony is shown in (P). Scale bars in D–F=25μm, G–J=20μm, C and L–T=100μm.

