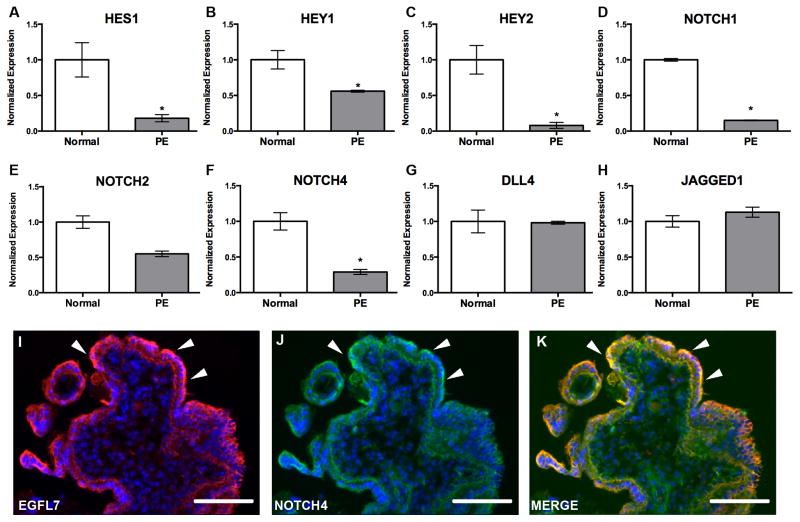
Figure 6. Expression of NOTCH target genes and NOTCH receptors are downregulated in PE, concomitant with EGFL7.
Real Time RT-PCR data for NOTCH pathway members on normal and preeclamptic (PE) human placentas (A–H). Gene expression analysis for HES1 (A), HEY1 (B), and HEY2 (C)demonstrating a significant decrease in all NOTCH target gene transcripts in PE. Gene expression analysis for NOTCH receptors NOTCH1 (D), NOTCH2 (E), and NOTCH4 (F) demonstrating a significant downregulation in NOTCH1 and NOTCH4, and a downward trend in NOTCH2 in PE patients. Gene expression analysis indicating no change in NOTCH ligands DLL4 (G) and JAGGED1 (H). (n=3–7, *P<0.05). Immunofluorescent staining of a cross section of human villi (I–K) for EGFL7 (red), NOTCH4 (green), and Hoechst (blue) (arrowheads-trophoblasts) shows colocalization of EGFL7 protein and NOTCH4. (*P<0.05) Scale bars = 50 μm.

