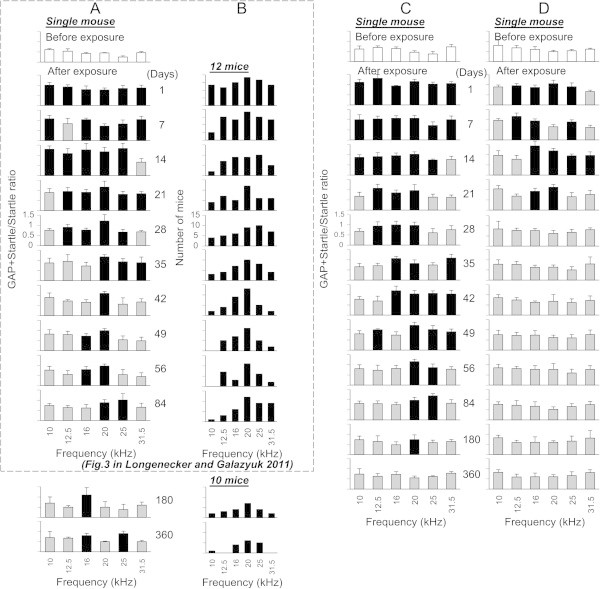
Figure 2.

Time-dependent changes of gap-induced suppression of the acoustic startle response in mice for a 360 day duration after sound exposure. (A) Changes in gap detection performance in a single sound exposed mouse. Open bars represent mean ± SD of (G + S)/S ratios measured before sound exposure. Grey and black bars represent the ratios which were (black bars) or were not (grey bars) significantly different from the control. (B) The histogram depicts only significant increases in the ratios as a function of background frequency (e.g. indicated by black bars in A) obtained from a sample of 12 sound-exposed mice. 2 out of 12 mice were lost after the 84 day time point so only 10 mice are represented at 180 and 360 day time points. (C) Changes in gap detection performance in a mouse which performance was recovered to the pre exposed level between 180 and 360 days after exposure. (D) Changes in gap detection performance in a mouse which did not show gap detection deficits at 84 days post exposure and continued show no deficits up to 360 days.
