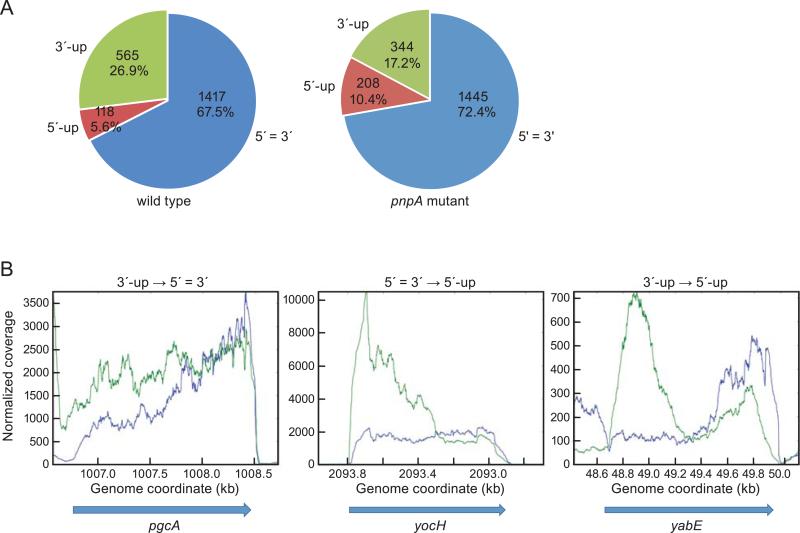
Fig. 2.
(A) Percent of genes in three 5’-3’ ratio categories in the wild-type and pnpA mutant strains. The categories are indicated outside the segments, with number of genes and percent of total inside each segment. (B) Change in 5’/3’ ratios upon loss of PNPase. Read data from wild-type (blue) and pnpA mutant (green) strains are shown, with the shift in category from wild type to mutant indicated above each graph.

