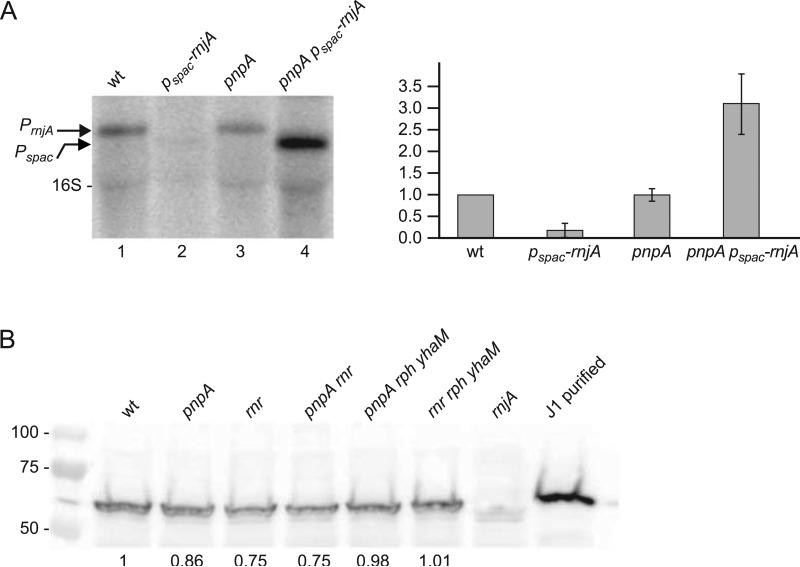
Fig. 3.
Analysis of RNase J1 expression in response to loss of PNPase. (A) Northern blot analysis of rnjA mRNA using a 5’-end-labeled oligonucleotide probe complementary to an internal sequence in the RNase J1 CDS. Arrows on left indicate migration of rnjA mRNA transcribed from its native promoter (PrnjA) or from an IPTG-inducible promoter (Pspac). Migration of 16S rRNA is also indicated. Quantitative data on right are average of three experiments, with rnjA mRNA level in the wild-type strain set to 1. (B) Western blot analysis of RNase J1 in ribonuclease mutant strains. Numbers below the blot are relative to RNase J1 detected in the wild-type strain. 50 ng of purified RNase J1 was loaded in the control lane on the right. Numbers on the left indicate migration of protein molecular weight markers (kilodaltons).

