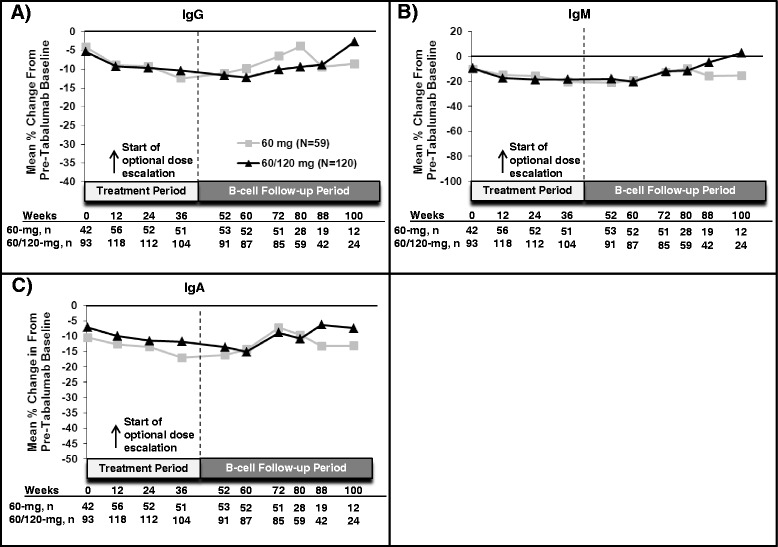
Figure 3.

Mean percentage changes in immunoglobulins. Mean percentage changes in immunoglobulin G (A), immunoglobulin M (B), and immunoglobulin A (C) are shown. The week 0 comparison is of the immunoglobulins to baseline counts before dosing with tabalumab. For patients receiving tabalumab in the first or second randomized controlled trial, the baseline count represents the immunoglobulin level at a time point prior to week 0 of this open-label extension study. Data after week 100 are not shown, as there were fewer than five patients per arm. Ig, Immunoglobulin; N, Number of patients per treatment arm; n, Number of patients assessed at a given time point.
