
Figure 5. Genes that are induced or repressed by acidic pH in a carbon source independent and dependent manner.
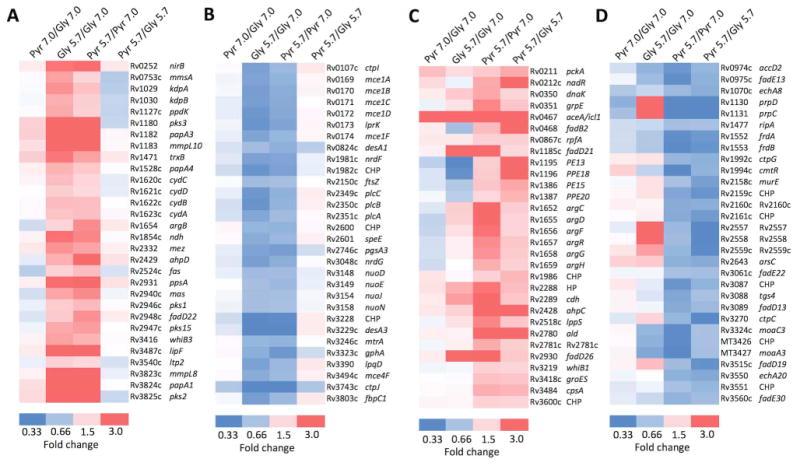
A. Selection of 30 genes (out of 185 total) that are induced by acidic pH in both glycerol and pyruvate without a significant difference in the induction (Table S5A). B. Selection of 30 genes (out of 134 total) that are repressed by acidic pH in both glycerol and pyruvate without difference in the induction (Table S5C). C. Selection of 30 genes (out of 60 total) that are induced at pH 5.7 in pyruvate and the induction is significantly greater in pyruvate as compared to glycerol (Table S5B). D. Selection of 30 genes (out of 75 total) that are repressed at pH 5.7 in pyruvate and the repression is significantly greater in pyruvate as compared to glycerol (Table S5D). CHP, conserved hypothetical protein; HP hypothetical protein.