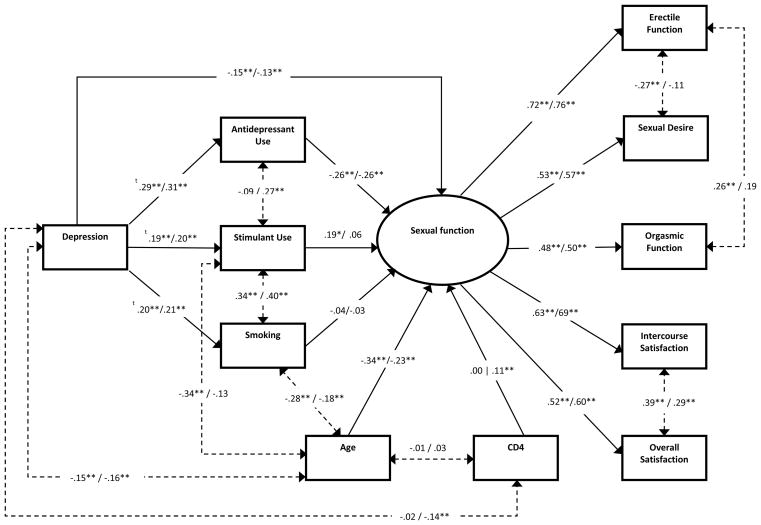
Figure 1.
Final Structural Equation Model with Standardized Estimates. Solid lines represent regression paths while dashed lines represent covariance relations. The HIV-negative group coefficients appear to the left of the slash while the HIV-positive appear to the right. ** p < .01, * p < .05, t probit coefficients

