Figure 3.

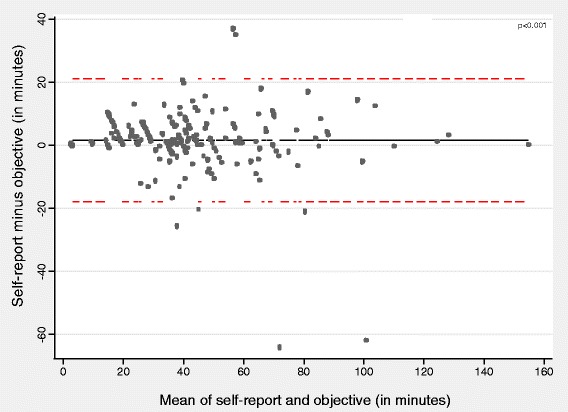
Bland-Altman plot for agreement between travel-diary and objective estimates of total time spent travelling. Solid lines indicate the mean difference, whilst dotted lines indicate the 95% limits of agreement.

Bland-Altman plot for agreement between travel-diary and objective estimates of total time spent travelling. Solid lines indicate the mean difference, whilst dotted lines indicate the 95% limits of agreement.